

Data quality control
Checked climate data sets are a sine qua non for all projects that are studying questions of environment and climate. Moreover, such data sets are used as input for various simulation models, studies on climate variability, climatological mapping and extreme value analysis. When investigating extreme events like periods of strong precipitation, drought periods and similar phenomena, climate data in high temporal resolution are needed, at least in daily resolution.
Quality control of daily data is based on a multi-stage approach. In the process of testing historical time series, internal, temporal and climatological consistency checks were performed. In addition to these routine quality checks data are tested by means of additional spatial and statistical test procedures. Due to this fact the task of data quality control for this project was the data-acquisition, -digitalization, -correction and in the last instance the data-homogenization of meteorological parameters, mainly available in daily resolution.
To supply the data in outstanding and uniform quality, the collected and partly new digitalized datasets were tested within a multi-stage-quality-control process that was subdivided into 6 steps:
1. PRE-Checks - during collecting /transforming/ importing data: This includes outlier tests, threshold tests and temporal consistency checks. The first step was to flag suspected values, correct set default values and correct offsets.
2. Completeness checks: These tests checked the completeness of the incoming data sets. This is an outstanding point for further steps in the project such as calculation of monthly sums which depend on complete datasets. The corrective actions are comprised of interpolation of values and flagging edited values. Helpful tools for this quality control process were the original records of thermo-hygrograph strips and climate sheets as well as radar pictures.
3. Climatological checks: These tests determined if all values are within a climatological threshold range. These threshold ranges depend on geographic position of the station and the time of measurement. The data value will determined as suspected if it comes below a Minimum or overrun a Maximum. So the controller has to decide if this value will be edited or confirmed as correct. This guaranteed that extreme weather conditions which disagree with normal climatological conditions won’t be distorted by the test system.
4. Plausibility-inner consistency checks: This logical check tested the different parameters of time series on plausibility, for instance the difference of two measurements of temperature sensors is not allowed to overrun a maximum value. After repeated control the auditor decides how to handle the suspected data value.
5. Spatial consistency checks: Daily values of one station were compared with daily values of a predefined and moreover variable number of reference stations.
6. Supplementary checks, or POST-checks: For the POST checks a number of supplementary software applications (e.g.: testing tool for snow or global radiation), mainly developed in-house were performed. By the implementation of these modules and routines – based on spatial and statistical test algorithms - many outliers and errors could be detected, flagged and automatically or manually corrected as needed. One of the supplementary software applications is now a fixed component in data quality control of the ZAMG.
Most of the difficulties of the data quality control arise from:
-
-
-
- the digitalization of old climate sheets due to input data errors
- inhomogeneity in time series due to the location, e.g. growing trees in the neighbourhood of a Stevenson screen
- blackout of technical sensors
- bias of technical sensors due to environmental conditions, e.g. in winter seasons technical sensors could be snowed in or frozen and so datasets are missing until the person in support checked out the station
-
-
For this project daily datasets of 1460 stations were checked for the period of 01.01.1981 until 31.12.2010. Only for chosen reference stations, so called key stations, the whole time series were checked and used for data- homogenisation (see also chapter homogenisation).
In total ~ 1,14% were suspected values and ~ 1 % of the whole datasets (~584 million values) have been corrected.
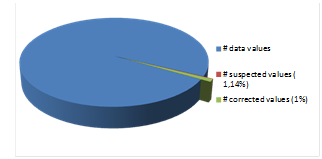
Fig.1: Whole dataset, suspected values (~1,14%), corrected values (~1%)
The diagram below shows that the most commonly corrected values concerned the parameters precipitation, minimum of temperature, maximum of temperature, temperature, snow, fresh snow and global radiation. But beware, not all climatological stations measure all parameters.
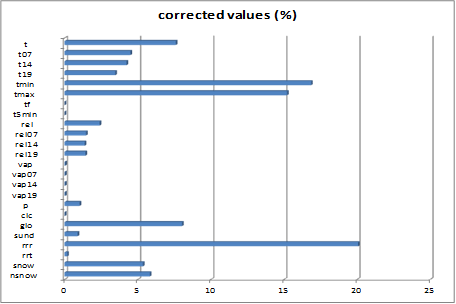
Fig.2: Parameter definition: t: mean daily 2 m air temperature, t07/14/19: air temperature at 07 MOZ/14 MOZ/ 19 MOZ, tmin: minimum of 2 m air temperature, tmax: daily maximum of 2 m air temperature, tf: wet bulb temperature, t5min: 5 cm temperature, rel: mean daily relative humidty, rel07/14/19: relative humidity at 07 MOZ/14 MOZ/19 MOZ, vap: mean daily vapor pressure, vap07/14/19: vapor pressure at 07 MOZ/14 MOZ/19 MOZ, p: station pressure, clc: mean daily cloud cove, glo: daily sum of global radiation, sund: sunshine duration (0-24 MOZ), rrr: rain (24h), rrt:type of precipitation, snow: total snow height, nsnow: fresh snow height
Precipitation is one of the biggest challenges of data quality control which requires a lot of experience for data correction. The precipitation can occur as a very local event, just like thunderstorms, or as a large-scale event which can last for days. The topography of the countries, especially the alpine mountains and valleys, also represents a big challenge to data quality control and requires a lot of experience from our data quality control team.
Finally the error-corrected and flagged time series are used as a data base for homogeneity tests and climate maps as well as for climate studies and extreme value analysis.