

Climate – Variability and trends between Arlberg and the Dolomites
This investigation evaluates the presence and significance of trends in transalpine and thus cross-border climate data through 2010, the end of the current climate period. For this purpose homogenised daily values of minimum and maximum temperature and precipitation sums were used. The following study presents the first daily homogenisation for this climate data set. Due to resource limitations and the need for high spatial data density as a prerequisite for the application of the homogenisation method, further parameters like snow height or radiation were not examined. Details regarding the homogenisation are found in Homogenisation of temperature and precipitation. The division into regions follows the HISTALP-dataset (Auer et al., 1999, Böhm et al., 2009). The Northwest region is located north of the main Alpine crest, and east of Salzburg lies the Northeast region. The division between the Southwest and Southeast regions extends along the line Bruneck - Verona. Hence the region Southeast includes the Eastern Dolomites as opposed to the HISTALP classification. Finally the High-Alpine region is defined for areas higher than 1500 m above sea level. These classifications are adopted for the presented analysis, however, it is noted that the Northeast region is outside of the considered domain.
Temperature
Near-surface air temperature is one of, if not the central, parameter for climate inspection. Further indicators are derived based on the time-series of temperature, for example the number of summer or ice days. At 12 out of a total of 17 considered stations the consistency and quality of the homogenised temperature series is sufficient for an interpretation. The following statements are based on these 12 stations. The four stations Kufstein (KUF), Reutte (REU), St. Anton am Arlberg (ANT) and Innsbruck Universität (IBK) are located in the Northwest region. South of the main Alpine crest Sterzing (STZ), Lienz (LZ) and Bozen (BZ) constitute the Southwest region. The stations Sexten (SEX), Agordo (AGO), Asiago (ASI) and Fortogna (FOR) lie closer to the Mediterranean Sea and thus comprise the Southeast region. The High Alpine region is represented by Obergurgl (OBG) which lies at the main Alpine crest.
First of all we note that the variability, or year-to-year fluctuation, is high. Therefore, in order to make long-term trends more apparent, typically temporal averages over a couple of years are applied (low-pass filtering). In addition the spatial correlation for temperature is high, so averaging of data from nearby stations can show evolutions more clearly.
Let us consider the evolution of the mean annual temperature in the four regions as shown in Figure 1. Before 1934 only measurements from Innsbruck University exist. Until then the temperature level is around 1 to 2 °C below the current climate mean from the period 1981 to 2010. Looking at the low-pass filtered regional means, which clearly show an upward trajectory, we note that the regional averages appear to increase at the same rate in all four regions. The deviation towards warmer temperatures in the Southwest region before 1970 is caused by strikingly warm years recorded at Sterzing. Apart from that the tendency appears homogeneous across the considered regions at different height levels. In addition the trend shows similar characteristics from the Tyrolean northern Alpine ridge across the main Alpine crest up to the Veneto. Before 1980 fluctuations with a cycle of approximately ten years combined with a temperature increase of about 0.1 °C dominate. This magnitude is in good accordance with the global trend. Since the 1980s the warming trend clearly accelerates, in the 20 year period prior to 2000 the rise is about 0.6 – 1.0 °C which corresponds to 0.3 – 0.5 °C per decade. Since 1998 this trend is dampened. This “plateau effect”, or hiatus, is also observed globally (IPCC 2014). The causes are still debated, but natural climate variability in combination with changing ocean currents seem to play a role. 2 °C is a typical value for the deviation of a specific annual average from the regional mean.
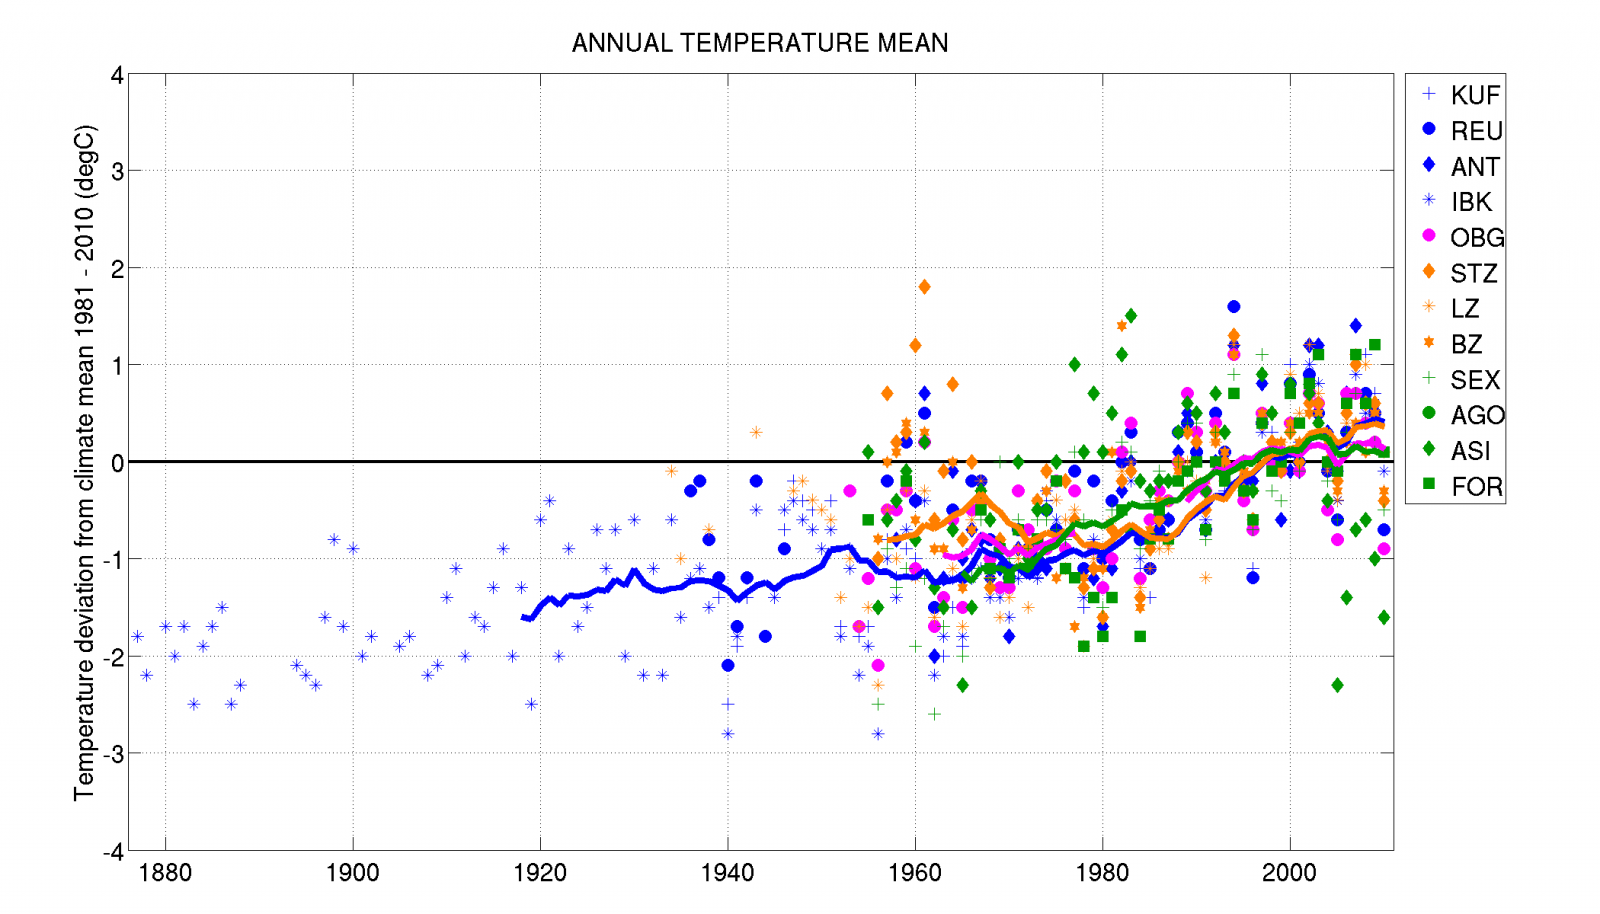
Fig. 1: Deviation of annual mean temperature from the respective climate mean for 1981 to 2010. Values at individual stations are represented by the symbols noted in the legend. Color codes mark the regions: Northwest is marked in blue, Southwest in orange, Southeast in green and the High Alpine region in magenta. Solid lines show the 11-year moving average.
However, the described development is not observed evenly throughout the year, but shows distinct features in individual seasons. The temporal evolution of summer temperature, summer being defined as the period from July until August (JJA), can be seen in Figure 2. Again it has to be stated that the changes appear similar across all regions. The following description is therefore valid for the considered domain from Arlberg up to the southern edges of the Dolomites. Until about 1960 quasi-periodical fluctuations dominate with no clear trend signal. Between 1960 and 1980 summers were consistently more than a degree colder than the period from 2000 to 2010. From1980 to 2000 summer temperatures rose on average by more than 1 °C. Since then the rise has slowed down as the previously mentioned plateau effect is also observed in summer. However, the outstanding summer of 2003, which stands out in Figure 2 with the strongest positive deviations from the mean, falls into this decade.
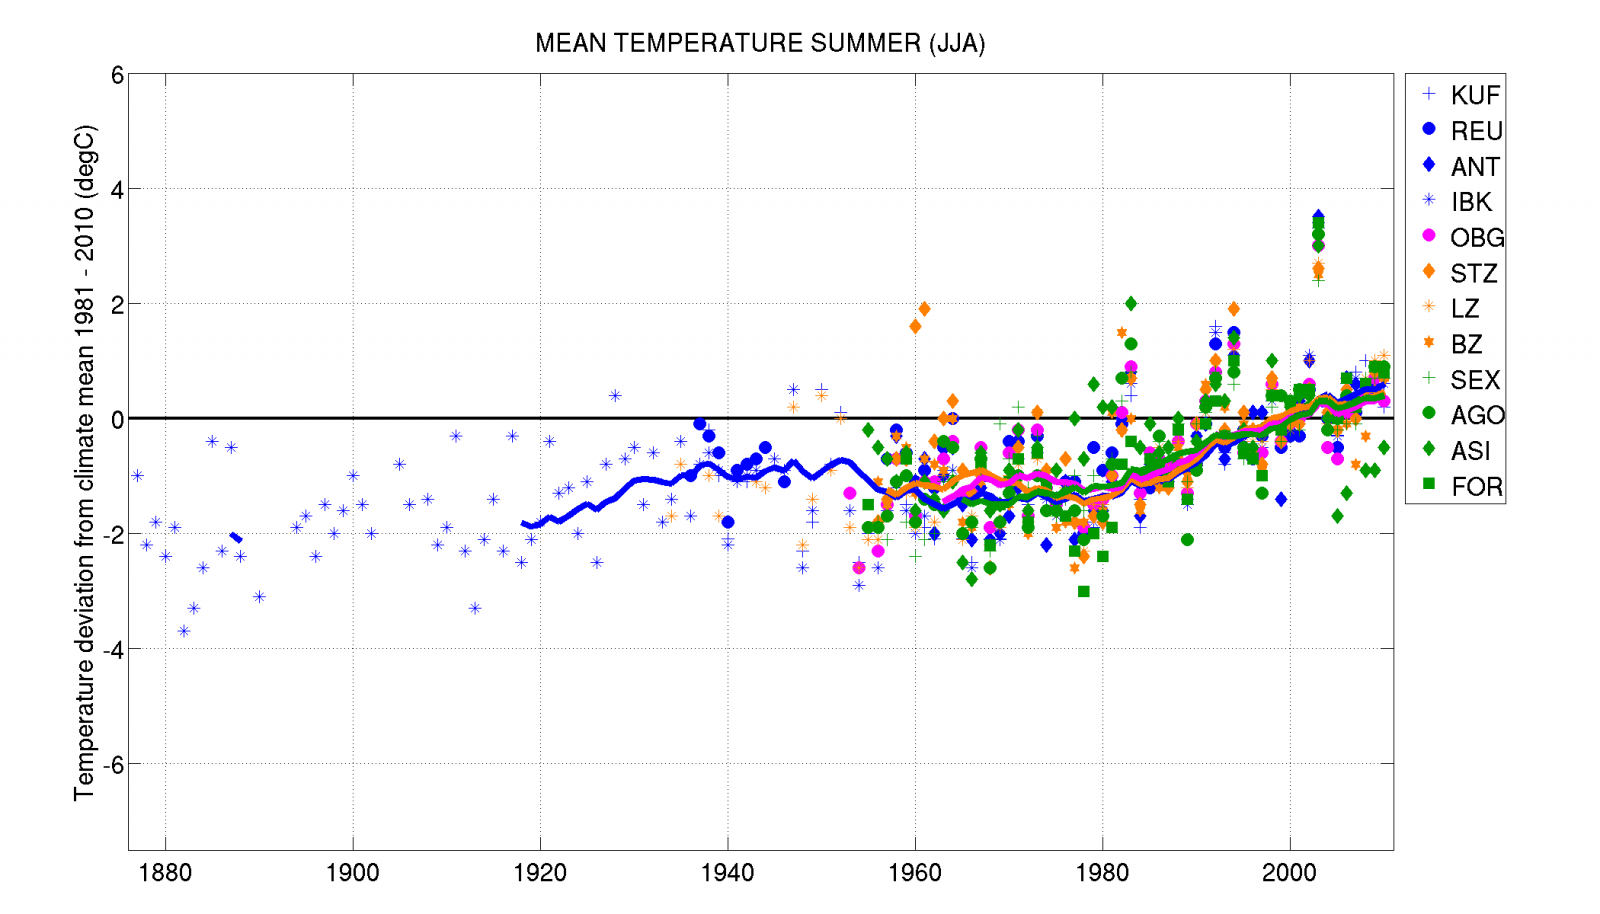
Fig. 2: Deviation of mean summer (JJA) temperature from the respective climate mean 1981 to 2010. Values at individual stations are represented by the symbols noted in the legend. Color codes mark the regions: Northwest is marked in blue, Southwest in orange, Southeast in green and the High Alpine region in magenta. Solid lines show the 11-year moving average.
Summer days are defined in climatology as days where the maximum temperature equals or exceeds 25 °C. If we compare the absolute numbers of summer days from Kufstein and Fortogna first (Figures 3 and 4), it is not surprising that fewer summer days occur at the station in North Tyrol (average 49) than at the Veneto station (average 63). However, the change in the past decades has been similar at both stations. Until 1980 the year-to-year variability is dominant. This period is followed by a significant rise and since then the number of summer days has settled on a high level. A record-breaking high was reached in 2003. Considering a linear trend, summer days in Kufstein have increased by 31 in the 50 years since 1961, and hence doubled. Due to missing data the respective increase at Fortogna cannot be quantified easily, none the less the rise in days exceeding 25 °C is evident.
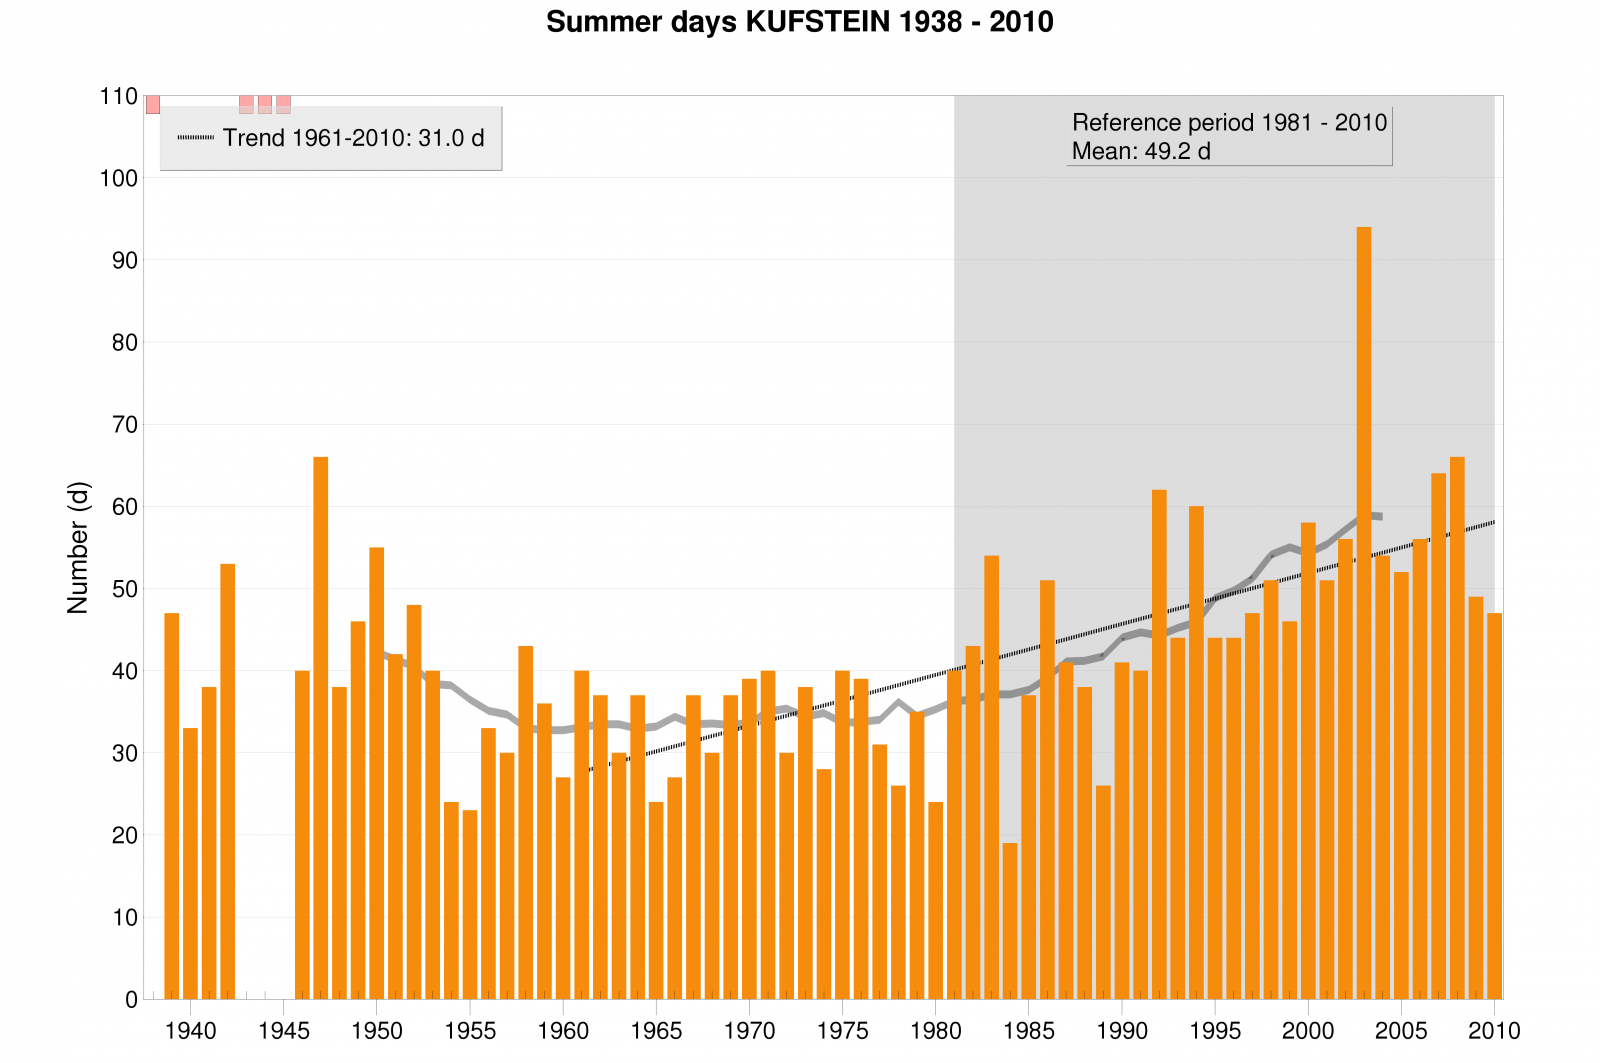
Fig. 3: Temporal evolution of the number of annual summer days in Kufstein.
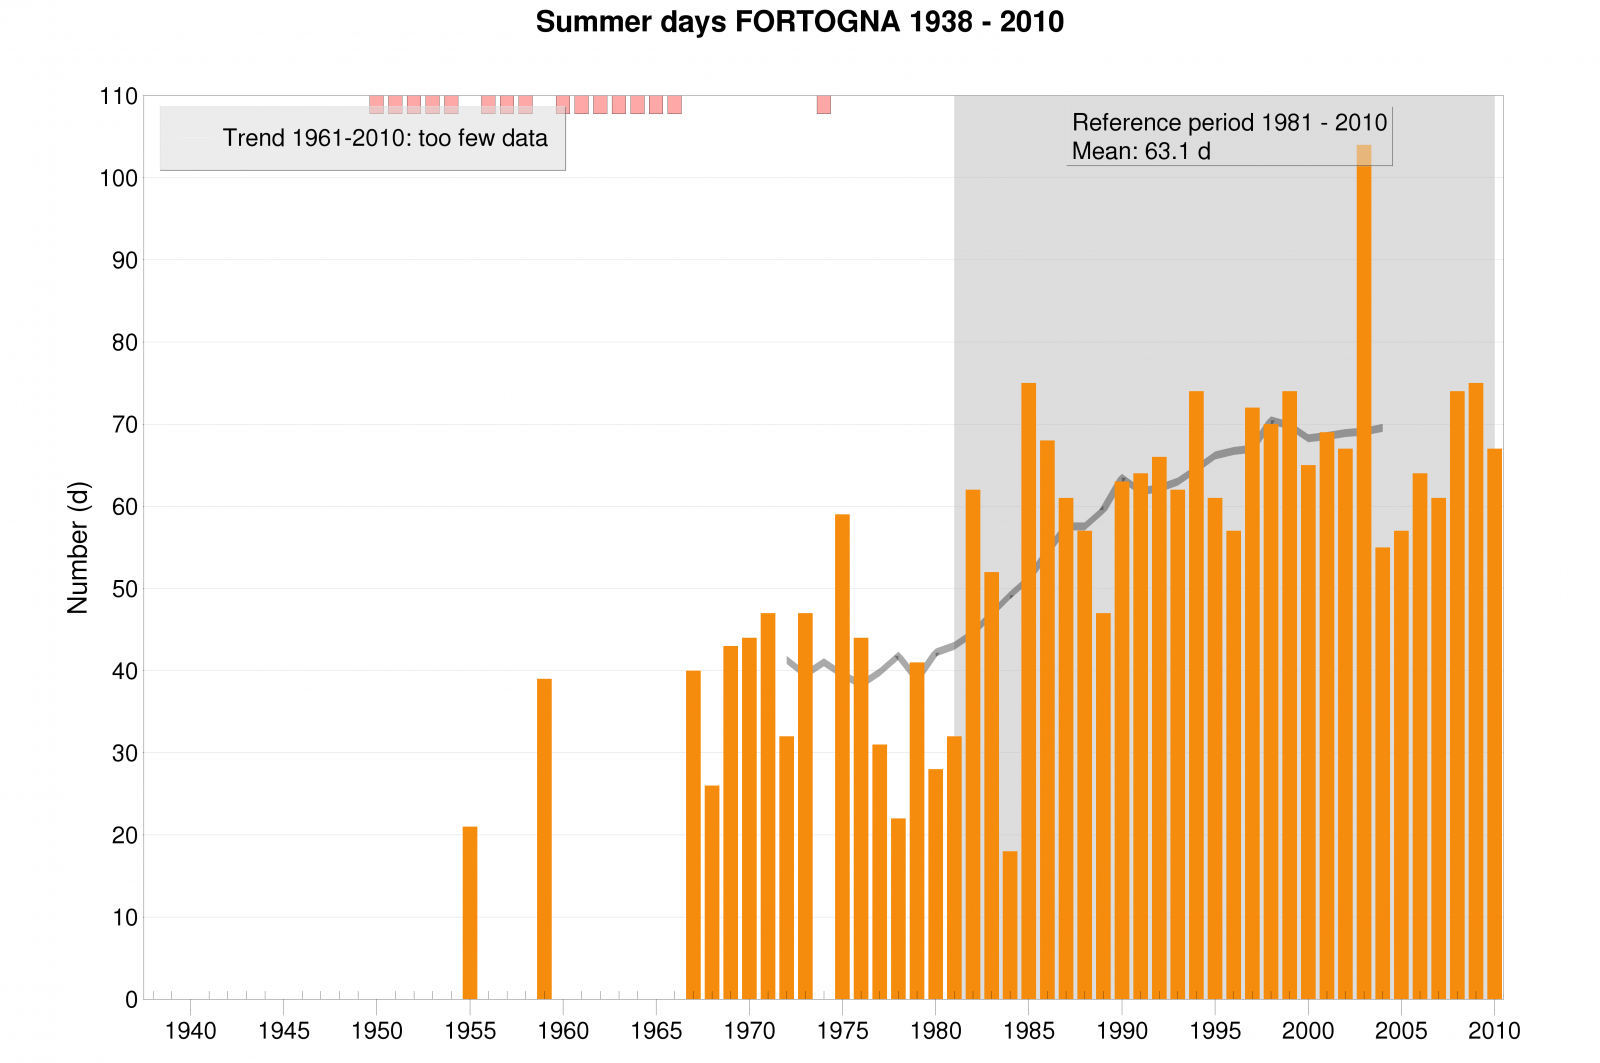
Fig. 4: Temporal evolution of the number of annual summer days in Fortogna.
Figure 5 points out the evolution of winter temperature over the last few decades. Winter includes the three months of December, January and February (DJF). First it is noted that the year-to-year variability is more pronounced in winter than in summer. This is due to the fact that in winter different air-masses can influence the considered region: at times cold continental air masses, at other times moderate maritime air masses. Also the bandwidth of annual deviation from the climate mean is higher in winter than in summer. Pronounced cold winters can be as much as 6° colder than the long-term mean. The trend is a combination of the described fluctuations and an increase since 1950 which culminates at the end of the 1990s. Since the 1990s a few winters have been colder than the climate mean.
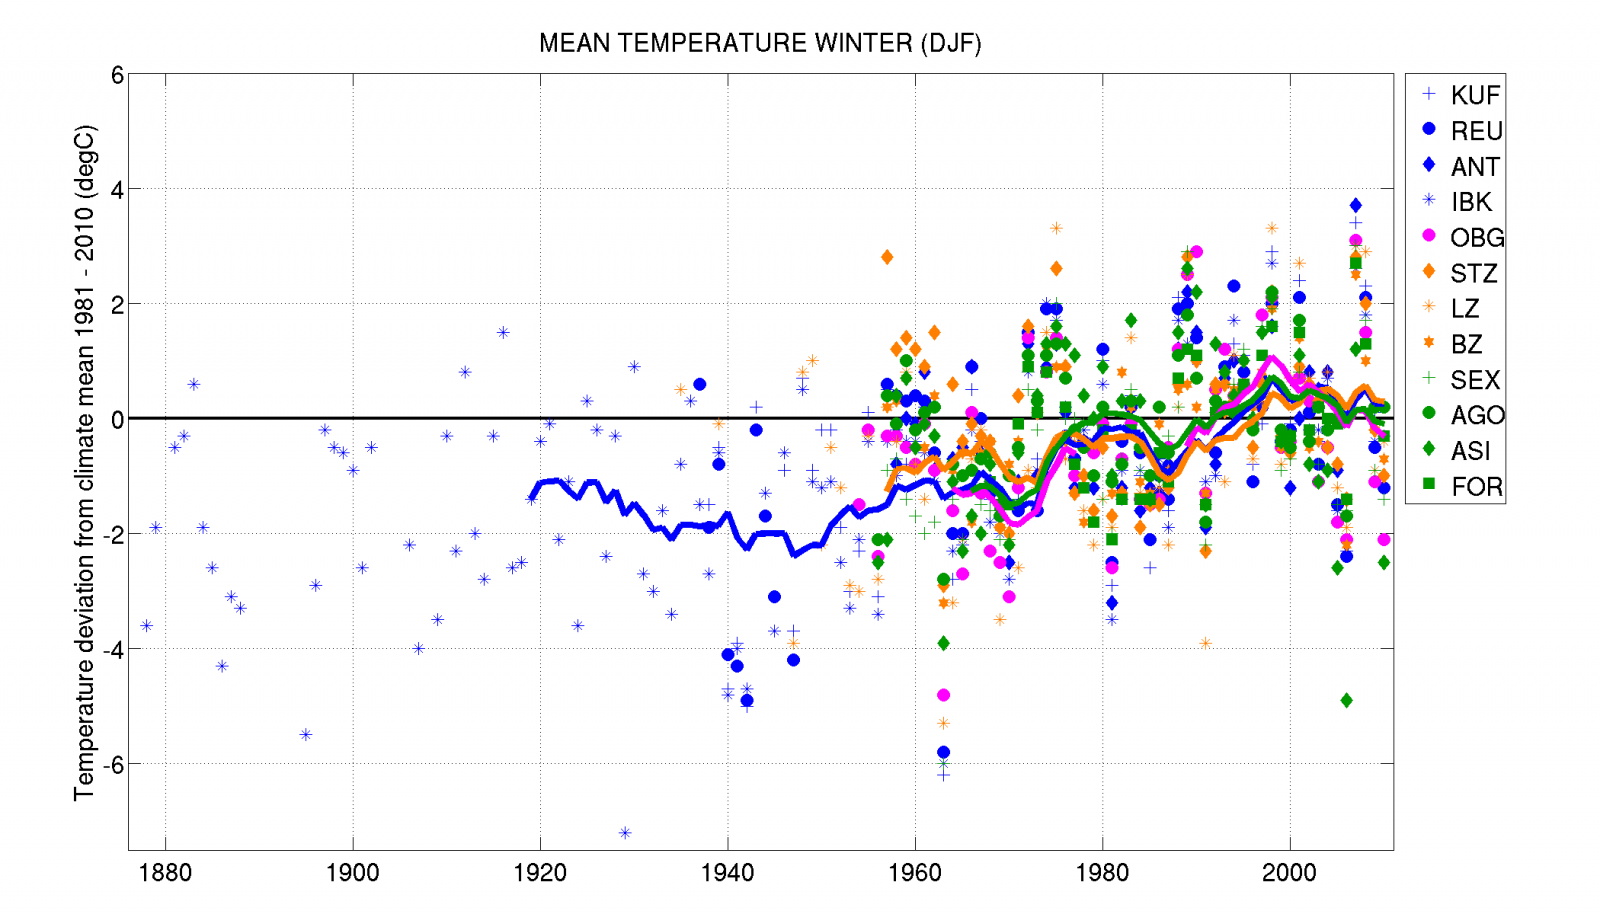
Fig. 5: Deviation of mean winter (DJF) temperature from the respective climate mean 1981 to 2010. Values at individual stations are represented by the symbols noted in the legend. Color codes mark the regions: Northwest is marked in blue, Southwest in orange, Southeast in green and the High Alpine region in magenta. Solid lines show the 11-year moving average.
What are the consequences for the frequency of cold days? To clarify this, ice days at Innsbruck and Sexten are compared, which represent stations north and south of the main Alpine crest (Figures 6 and 7). During ice days temperature remains below the freezing point. Due to the different height above sea level, the absolute number is higher at the northern edge of the Dolomites than in the Inn valley – compare the climate mean of 31 ice days in Sexten to just fewer than 15 days in Innsbruck. For both locations it is apparent that ice days have decreased since the mid-1960s. On average the number of days where temperature does not rise above 0 °C has reduced by half in Innsbruck when comparing 2001 – 2010 with the 1960s, while at Sexten ice days have reduced by a third.
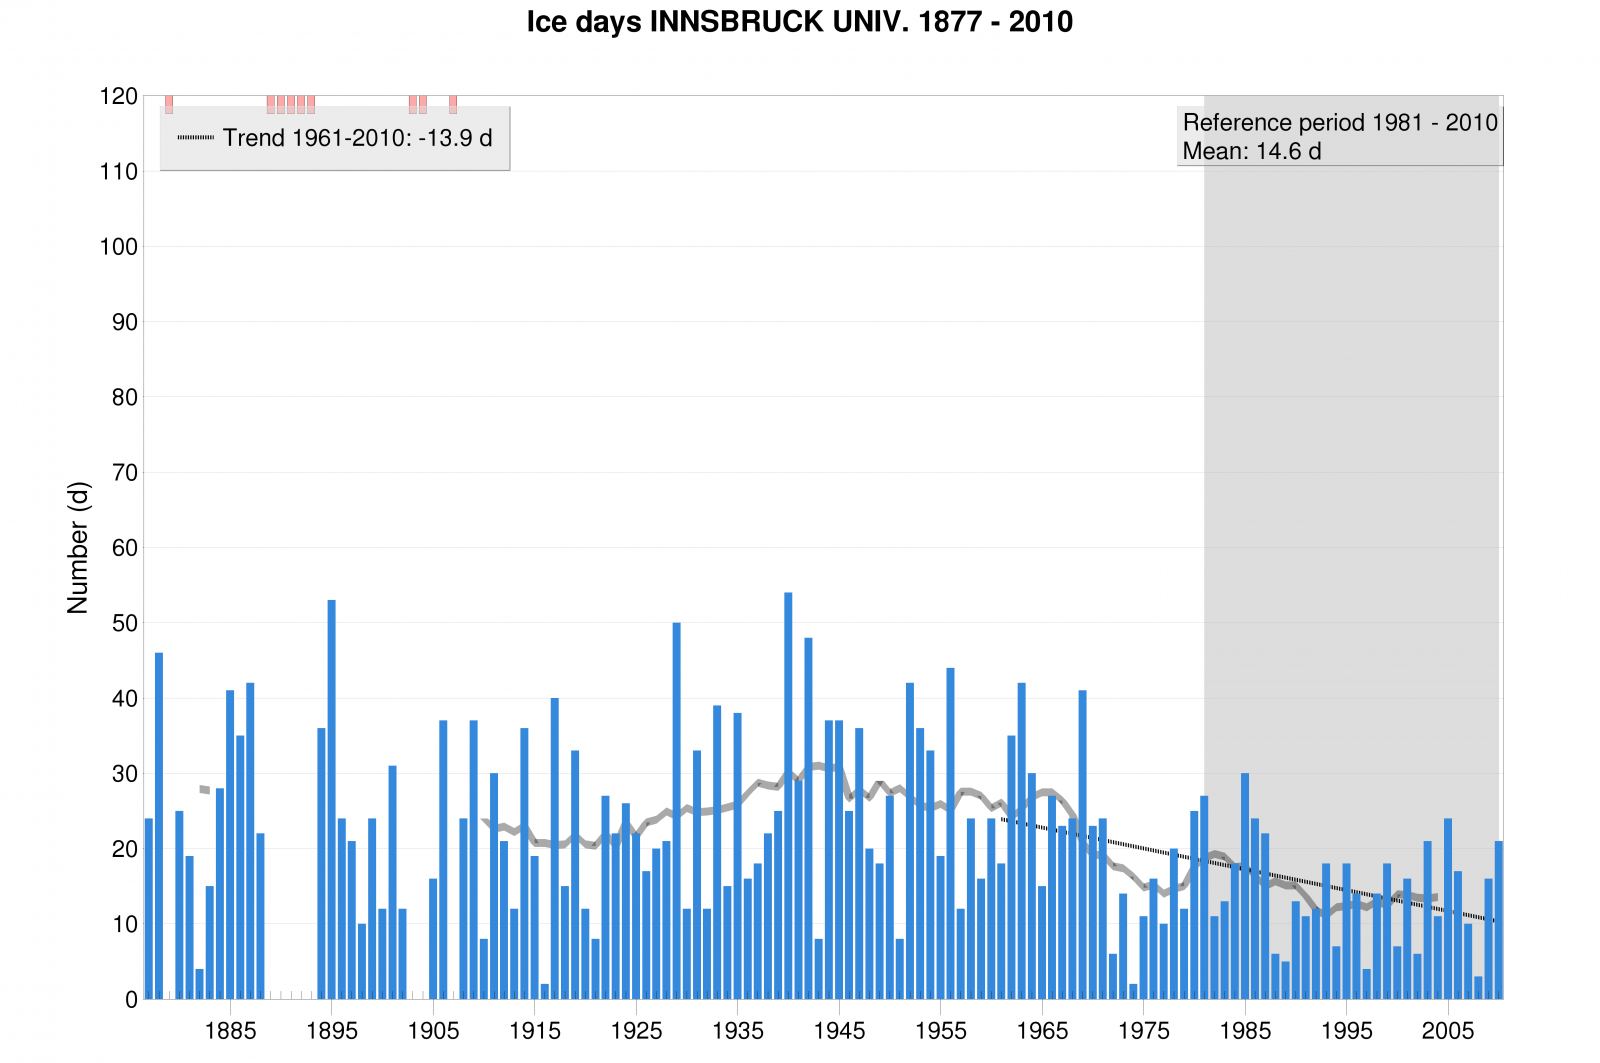
Fig. 6: Temporal evolution of the number of ice days at Innsbruck.
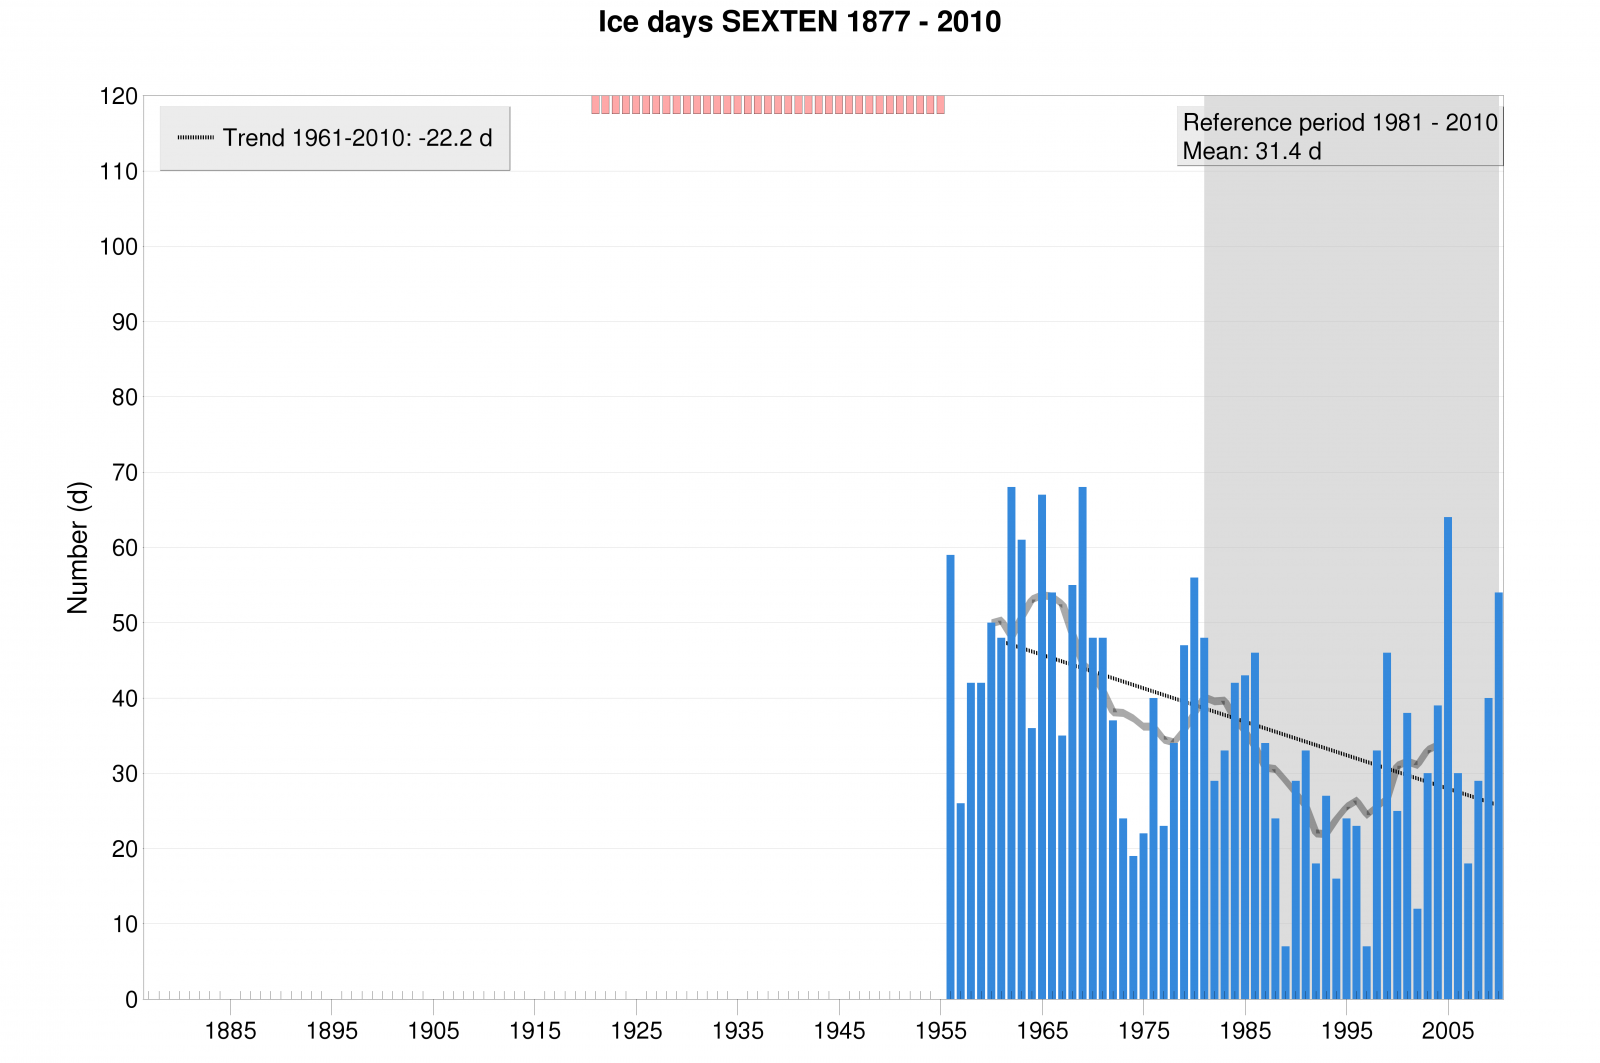
Fig. 7: Temporal evolution of the number of ice days at Sexten.
Spring, the months March to May (MAM), behaves similar to summer. However, autumn (September to November, SON) is dominated by natural climate variability. But even so at most of the considered stations the trend since 1961 is not significant, months in autumn currently tend to be warmer compared to those in the first half of the 20th century. Did that have an influence on plant growth, i.e. the photosynthetically active period? An indicator is the length of the vegetation period which is described in climatology as the period with long-term averaged daily mean temperature above 5°C. Since at lower elevations this is fulfilled throughout the summer, the vegetation period length depends primarily on weather conditions during spring and autumn. Trends north and south of the main Alpine crest are exemplified by the stations at Reutte and Lienz (Figures 8 and 9). The data from Reutte at the northern rim of the Alps indicate no clear tendency of the vegetation period. Years with longer and shorter growth periods alternate irregularly. However, at Lienz the vegetation period has clearly lengthened since the early 1960s by about 4 weeks. In the Lienz basin this is mainly due to warmer spring temperatures.
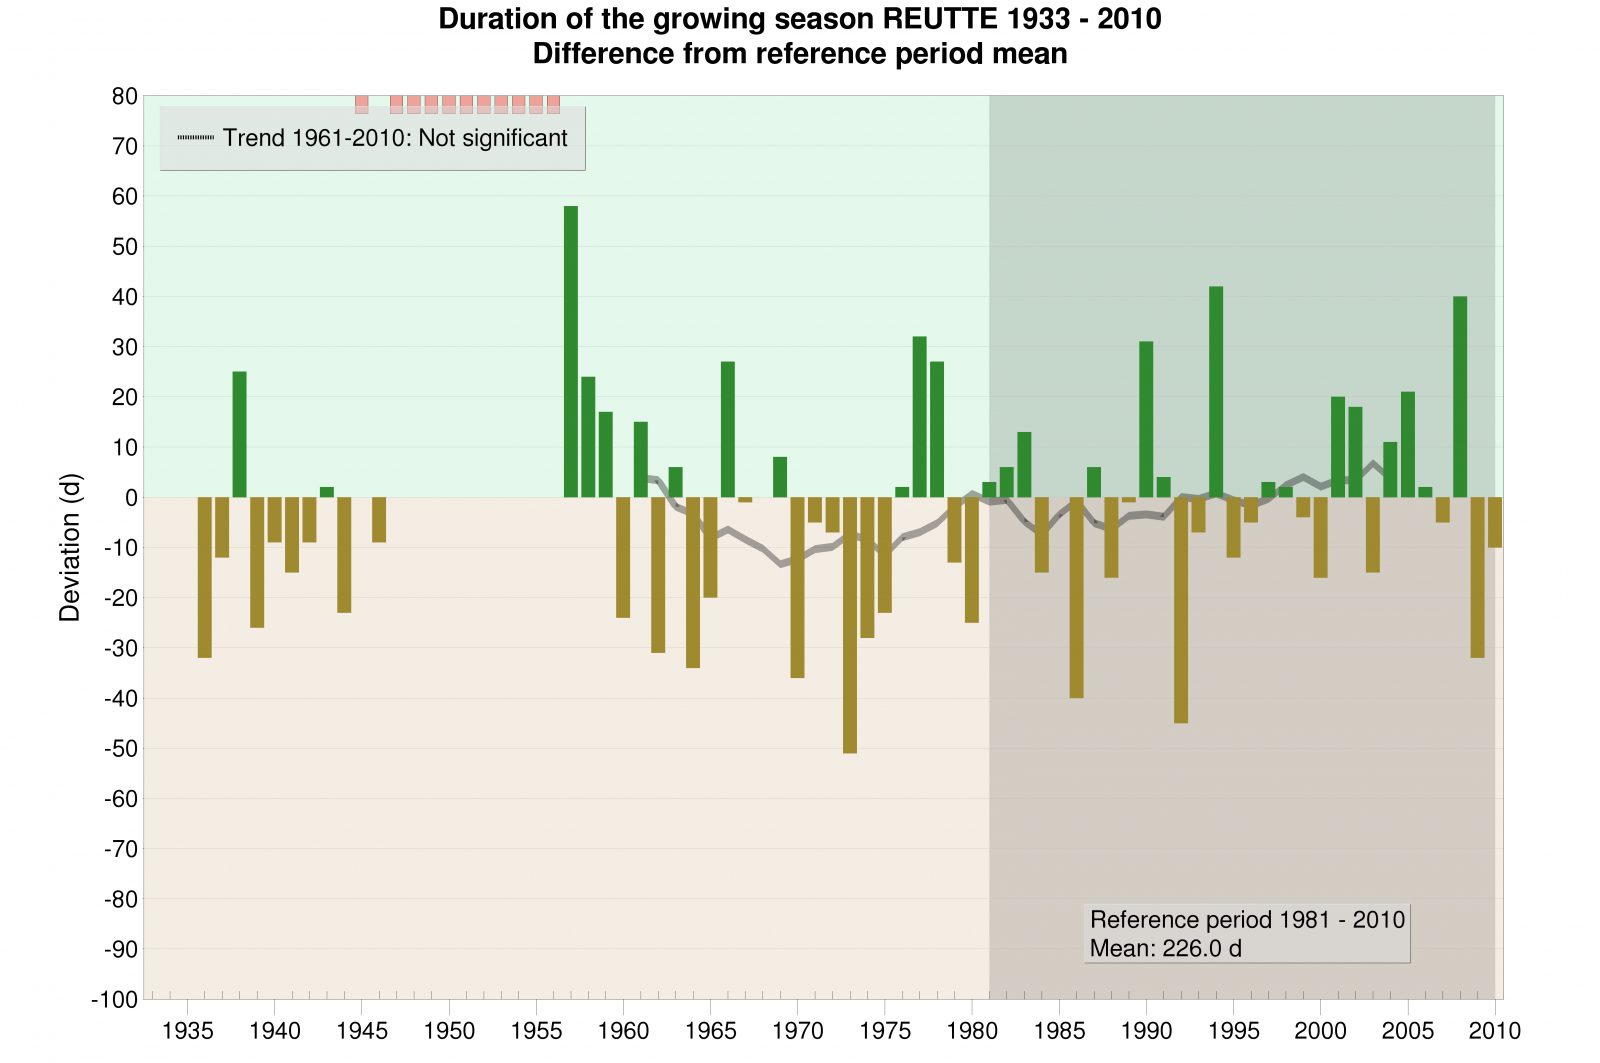
Fig. 8: Length of the vegetation period at Reutte.
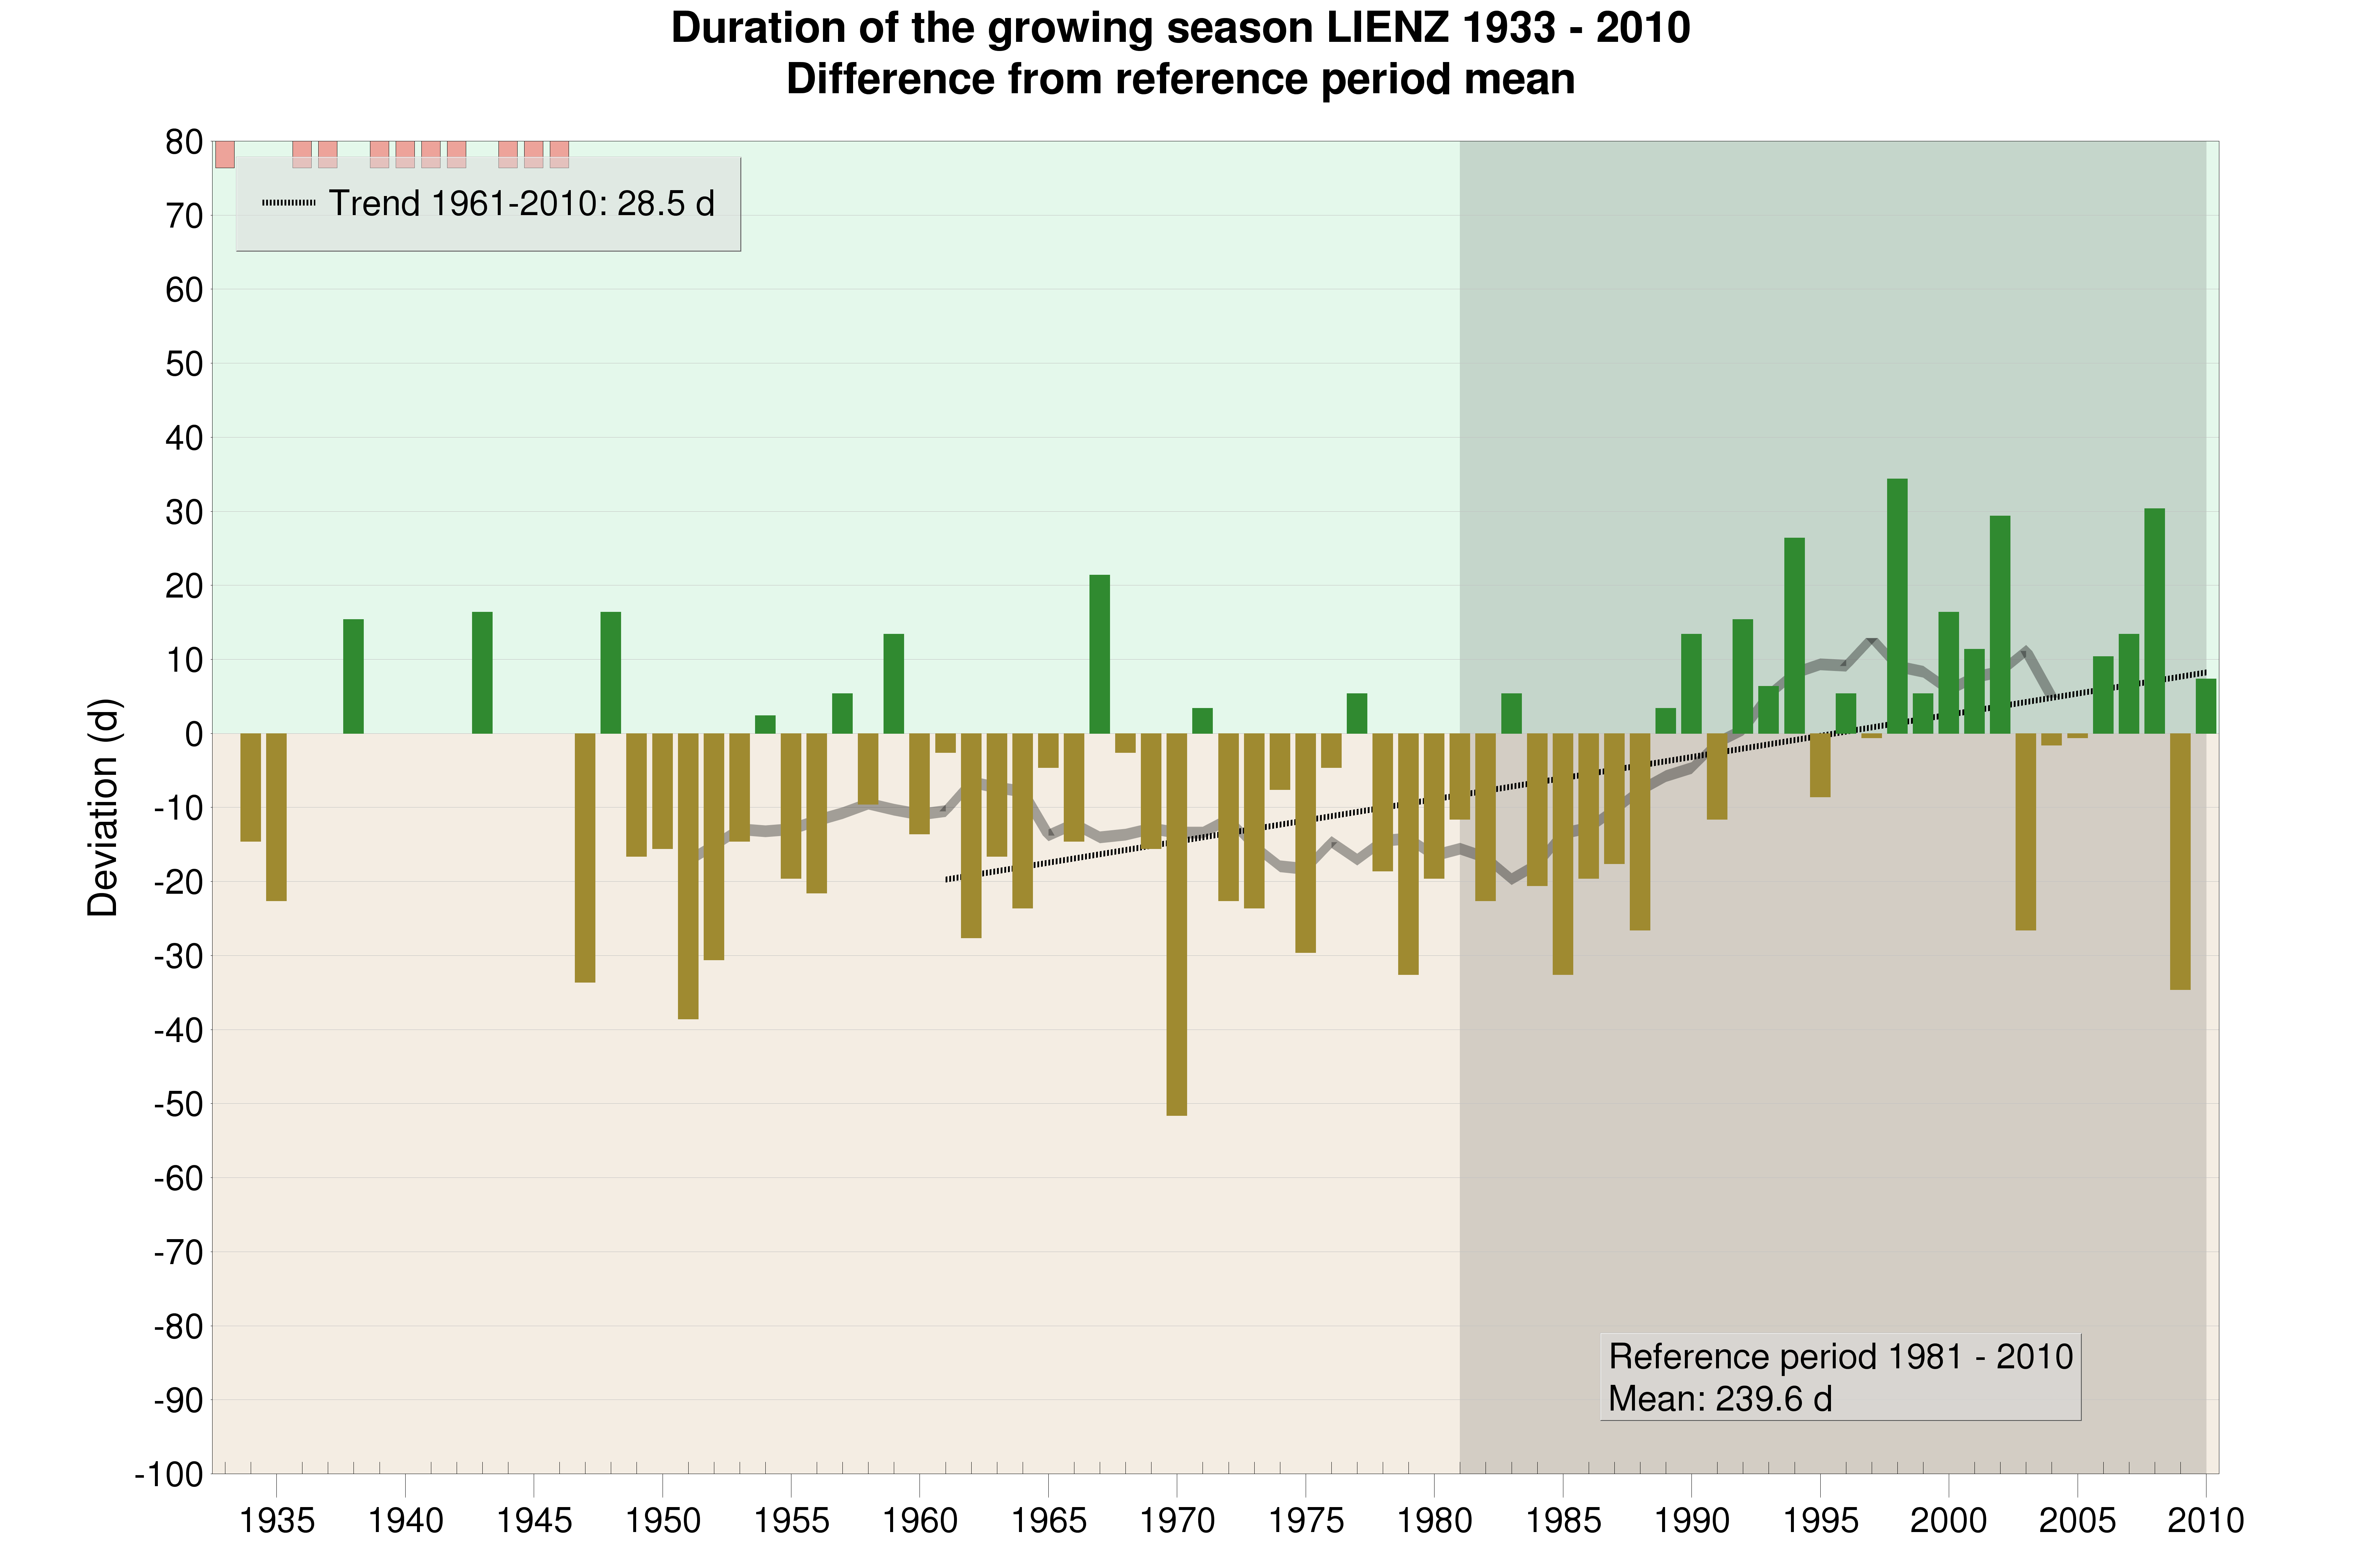
Fig. 9: Length of the vegetation period at Lienz.
Overall, temperature trends appear similar across the considered Alpine area from the Außerfern to Belluno including valleys and mountain peaks. Natural variability seems to dominate the annual mean prior to 1980. Since the 1980s the trend is clearly toward warmer temperatures. Since 2000 a “plateau effect” is visible, which is also observed globally. In spring and summer the consistent warming is especially apparent. Autumn temperatures have changed least over the past decades. In winter the year-to-year variability is high. However, since 1950 winters have also become warmer on average. The observed seasonal changes subsequently impact the derived climate indicators. The number of warm days generally increases, for example summer days or tropical days. On the other hand fewer ice and frost days are observed. In addition, the vegetation period appears to begin earlier during the latter portion of the climate period than it did in the 1950s.
Precipitation
In addition to the time series of temperature, precipitation was also investigated. For these trend analyses data-series of the following stations from the Southwest region were used to supplement the measurement locations described above: St. Martin (STM) in Passeier, Marienberg (MAR) in the upper Vinschgau, Brixen (BRI) im Eisacktal and St. Magdalena (MAG) in Gsies. Also the Southeast region additionally included Forno di Zoldo (ZOL) in the south-east part of the Dolomites.
Precipitation in the Alpine area is mostly connected to large-scale weather systems (fronts) and small-scale, convective events in the warm season. Fronts which approach the Alps from Northwest are slightly weakened on their way across the European mainland. As fronts encounter the Alpine rim upward motion forces stronger precipitation. However, weather systems from the southwest frequently strengthen over the Gulf of Genoa or the Italian Riviera by gaining additional moisture from the Mediterranean Sea. These conditions can lead to particularly strong precipitation south of the main Alpine crest. At inner Alpine locations the average precipitation diminishes with increasing distance to the Alpine rims.
Both in the north and in the south, stations that are exposed to frontal systems from either side (Reutte, Kufstein, Asiago, Agordo and Fortogna) record 1300 to 1400 mm of annual precipitation as a long-term average. Typical annual sums for inner Alpine locations are between 700 mm in the broad valleys and basins at the southern side (Marienberg, Brixen, Bozen, Sterzing) and approximately 900 mm close to the main Alpine crest (Obergurgl, Innsbruck, Lienz). However, depending on the dominant large-scale weather pattern the resulting precipitation totals can strongly vary.
As can be seen in Figure 10, the annual deviation of precipitation from the long-term mean of the respective station is generally limited to 200 to 300 mm. In extreme cases the fluctuations at the northern Alpine rim can reach 600 mm and hence be doubled. In the Dolomites at the southeastern side of the Alps they can even triple (Figures 11 and 12). As mentioned above, extreme precipitation in the southeastern Dolomites is caused by a combination of blocked flow and forced upward motion due to large-scale southerly flow which frequently occurs in autumn (see climate maps Precipitation::monthly mean::April and Precipitation::mean annual maximum daily sum).
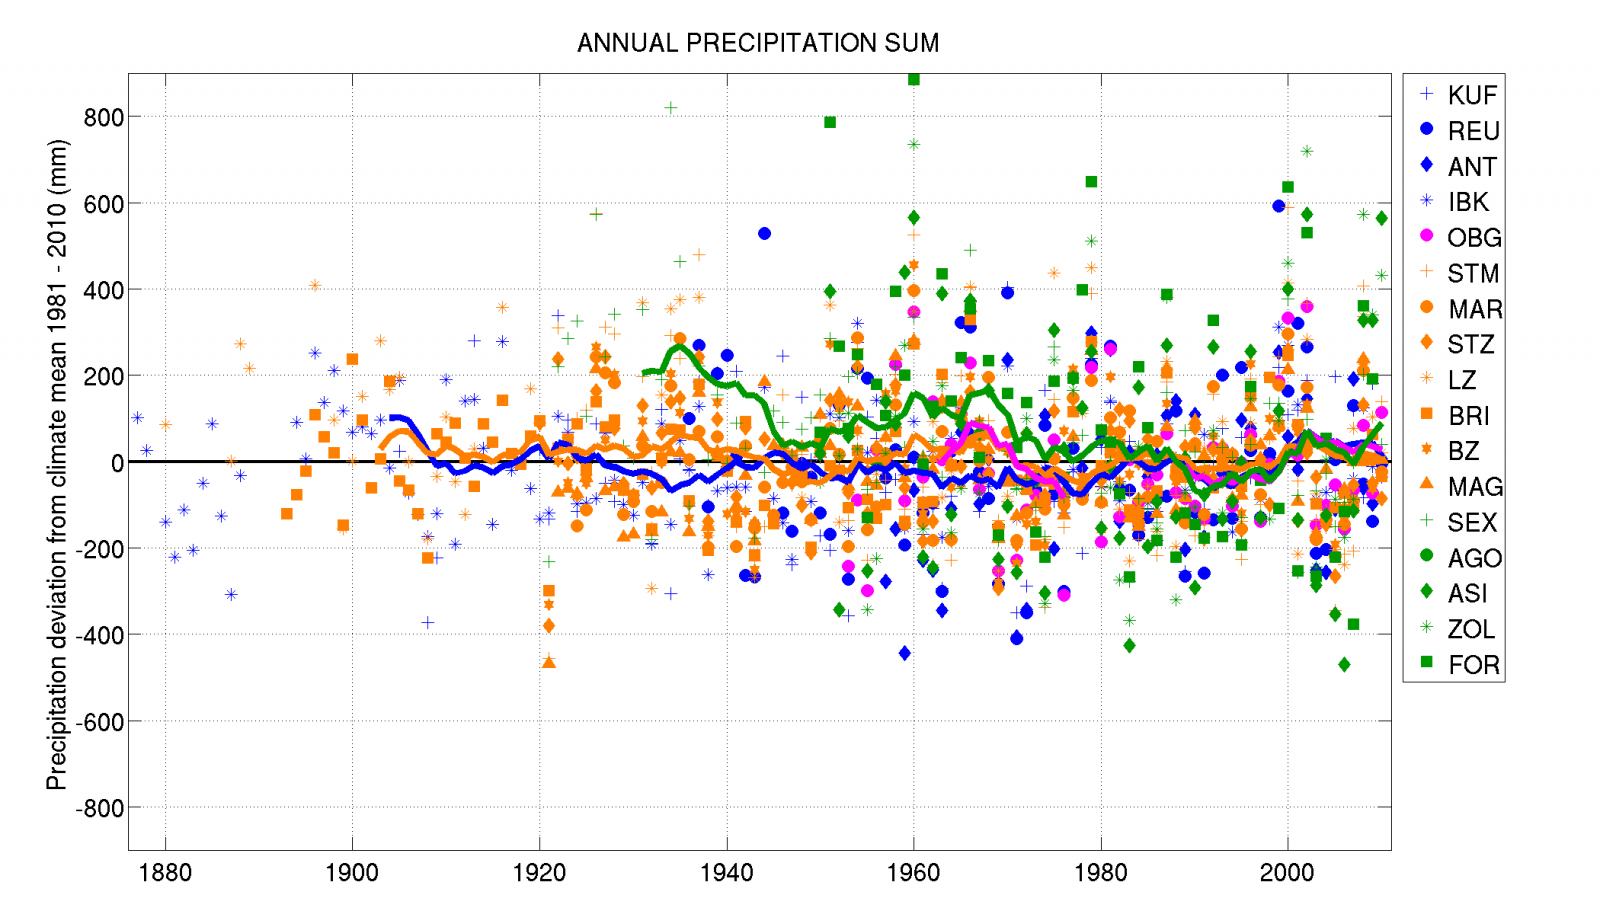
Fig. 10: Deviation of the annual precipitation sums from the respective climate mean 1981 to 2010. Values at individual stations are represented by the symbols noted in the legend. Color codes mark the regions: Northwest is marked in blue, Southwest in orange, Southeast in green and the High Alpine region in magenta. Solid lines show the 11-year moving average.
Unlike temperature (almost) no trends can be seen in precipitation. Only two exceptions were found. The first one concerns Southeast region. After relatively long above-average wet periods in the 1930s and between 1950 and 1970 it has become drier (Figure 10). Since then the long-term average fluctuates only marginally around the mean. An example of this decreasing tendency can be seen at station Fortogna (Figure 11). For the specified period 1961 to 2010 this trend is not significant at any considered location in the Dolomites.
An opposing significant increase in annual precipitation was recorded at station Kufstein at the northern Alpine rim (Figure 12). Here the annual sum gained 120 mm over the period from 1961 to 2010. At other locations in the northwest of the considered region no significant trend is observed, for example at Reutte (Figure 13). The same holds true for all climate indicators connected to heavy rainfall. Neither the highest daily nor the highest 5-day precipitation events have significantly changed within this region.
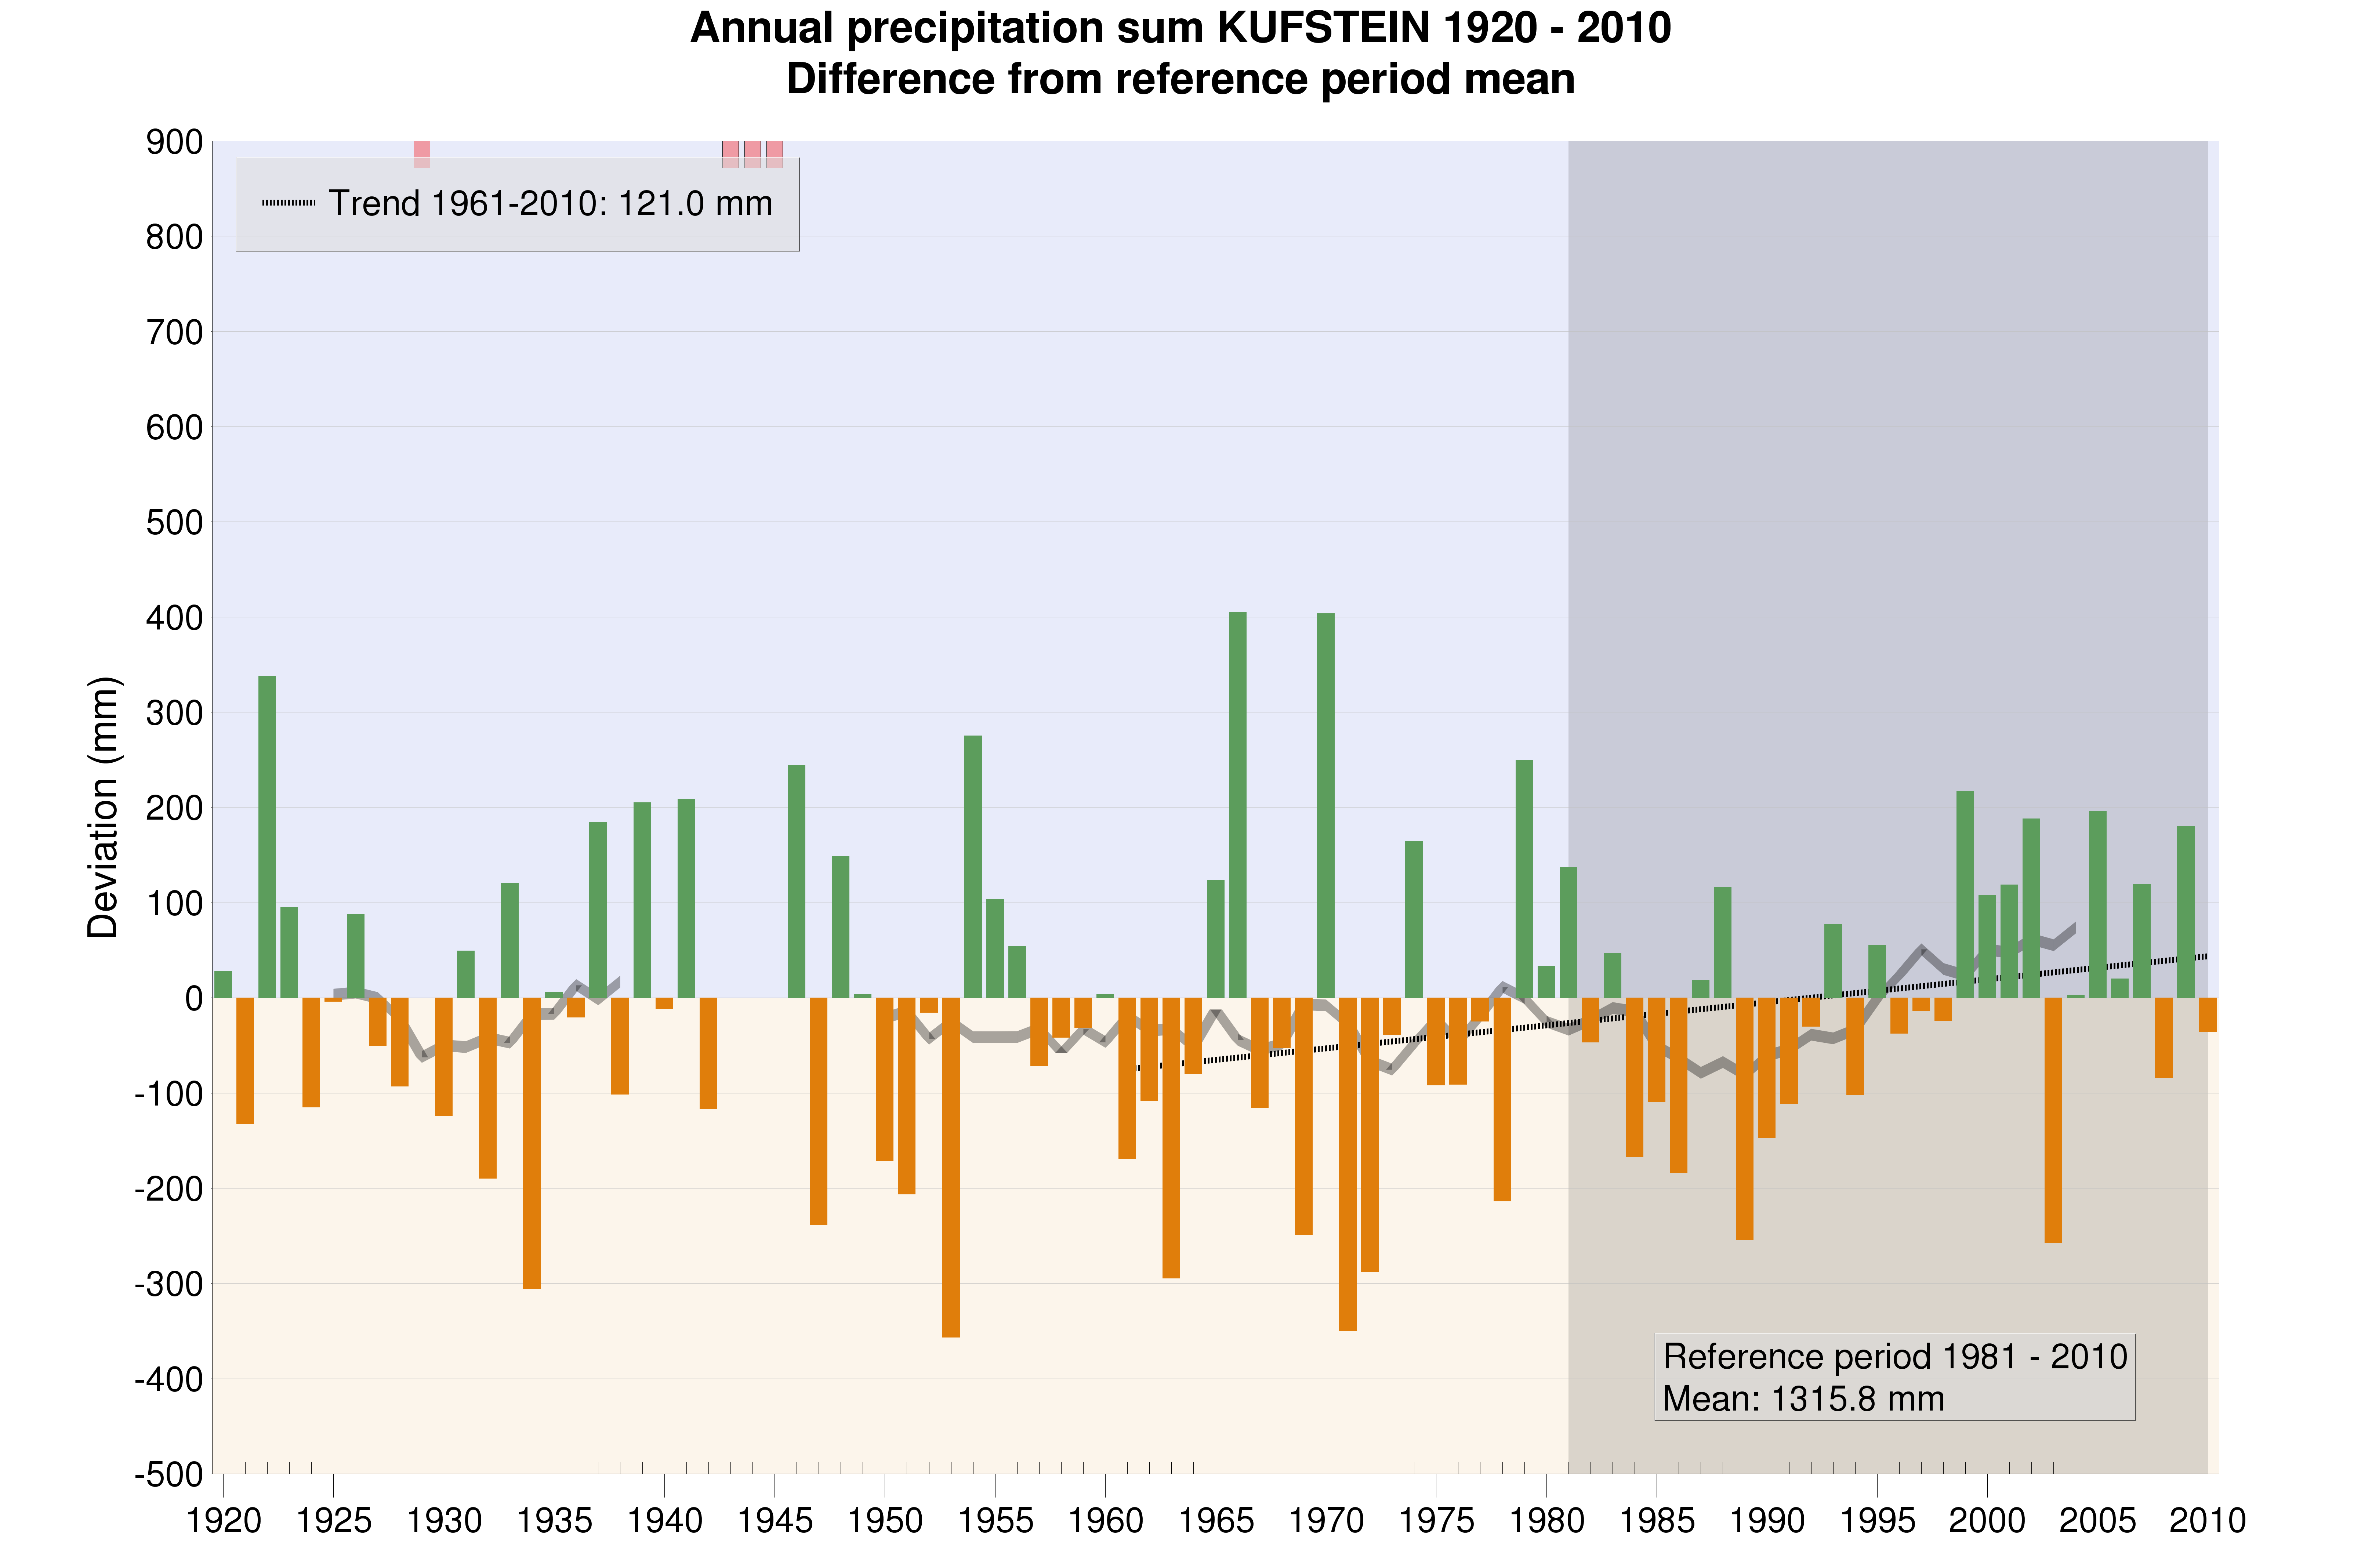
Fig. 11: Annual precipitation sum at Kufstein, shown as deviation from the climate mean 1981 to 2010.
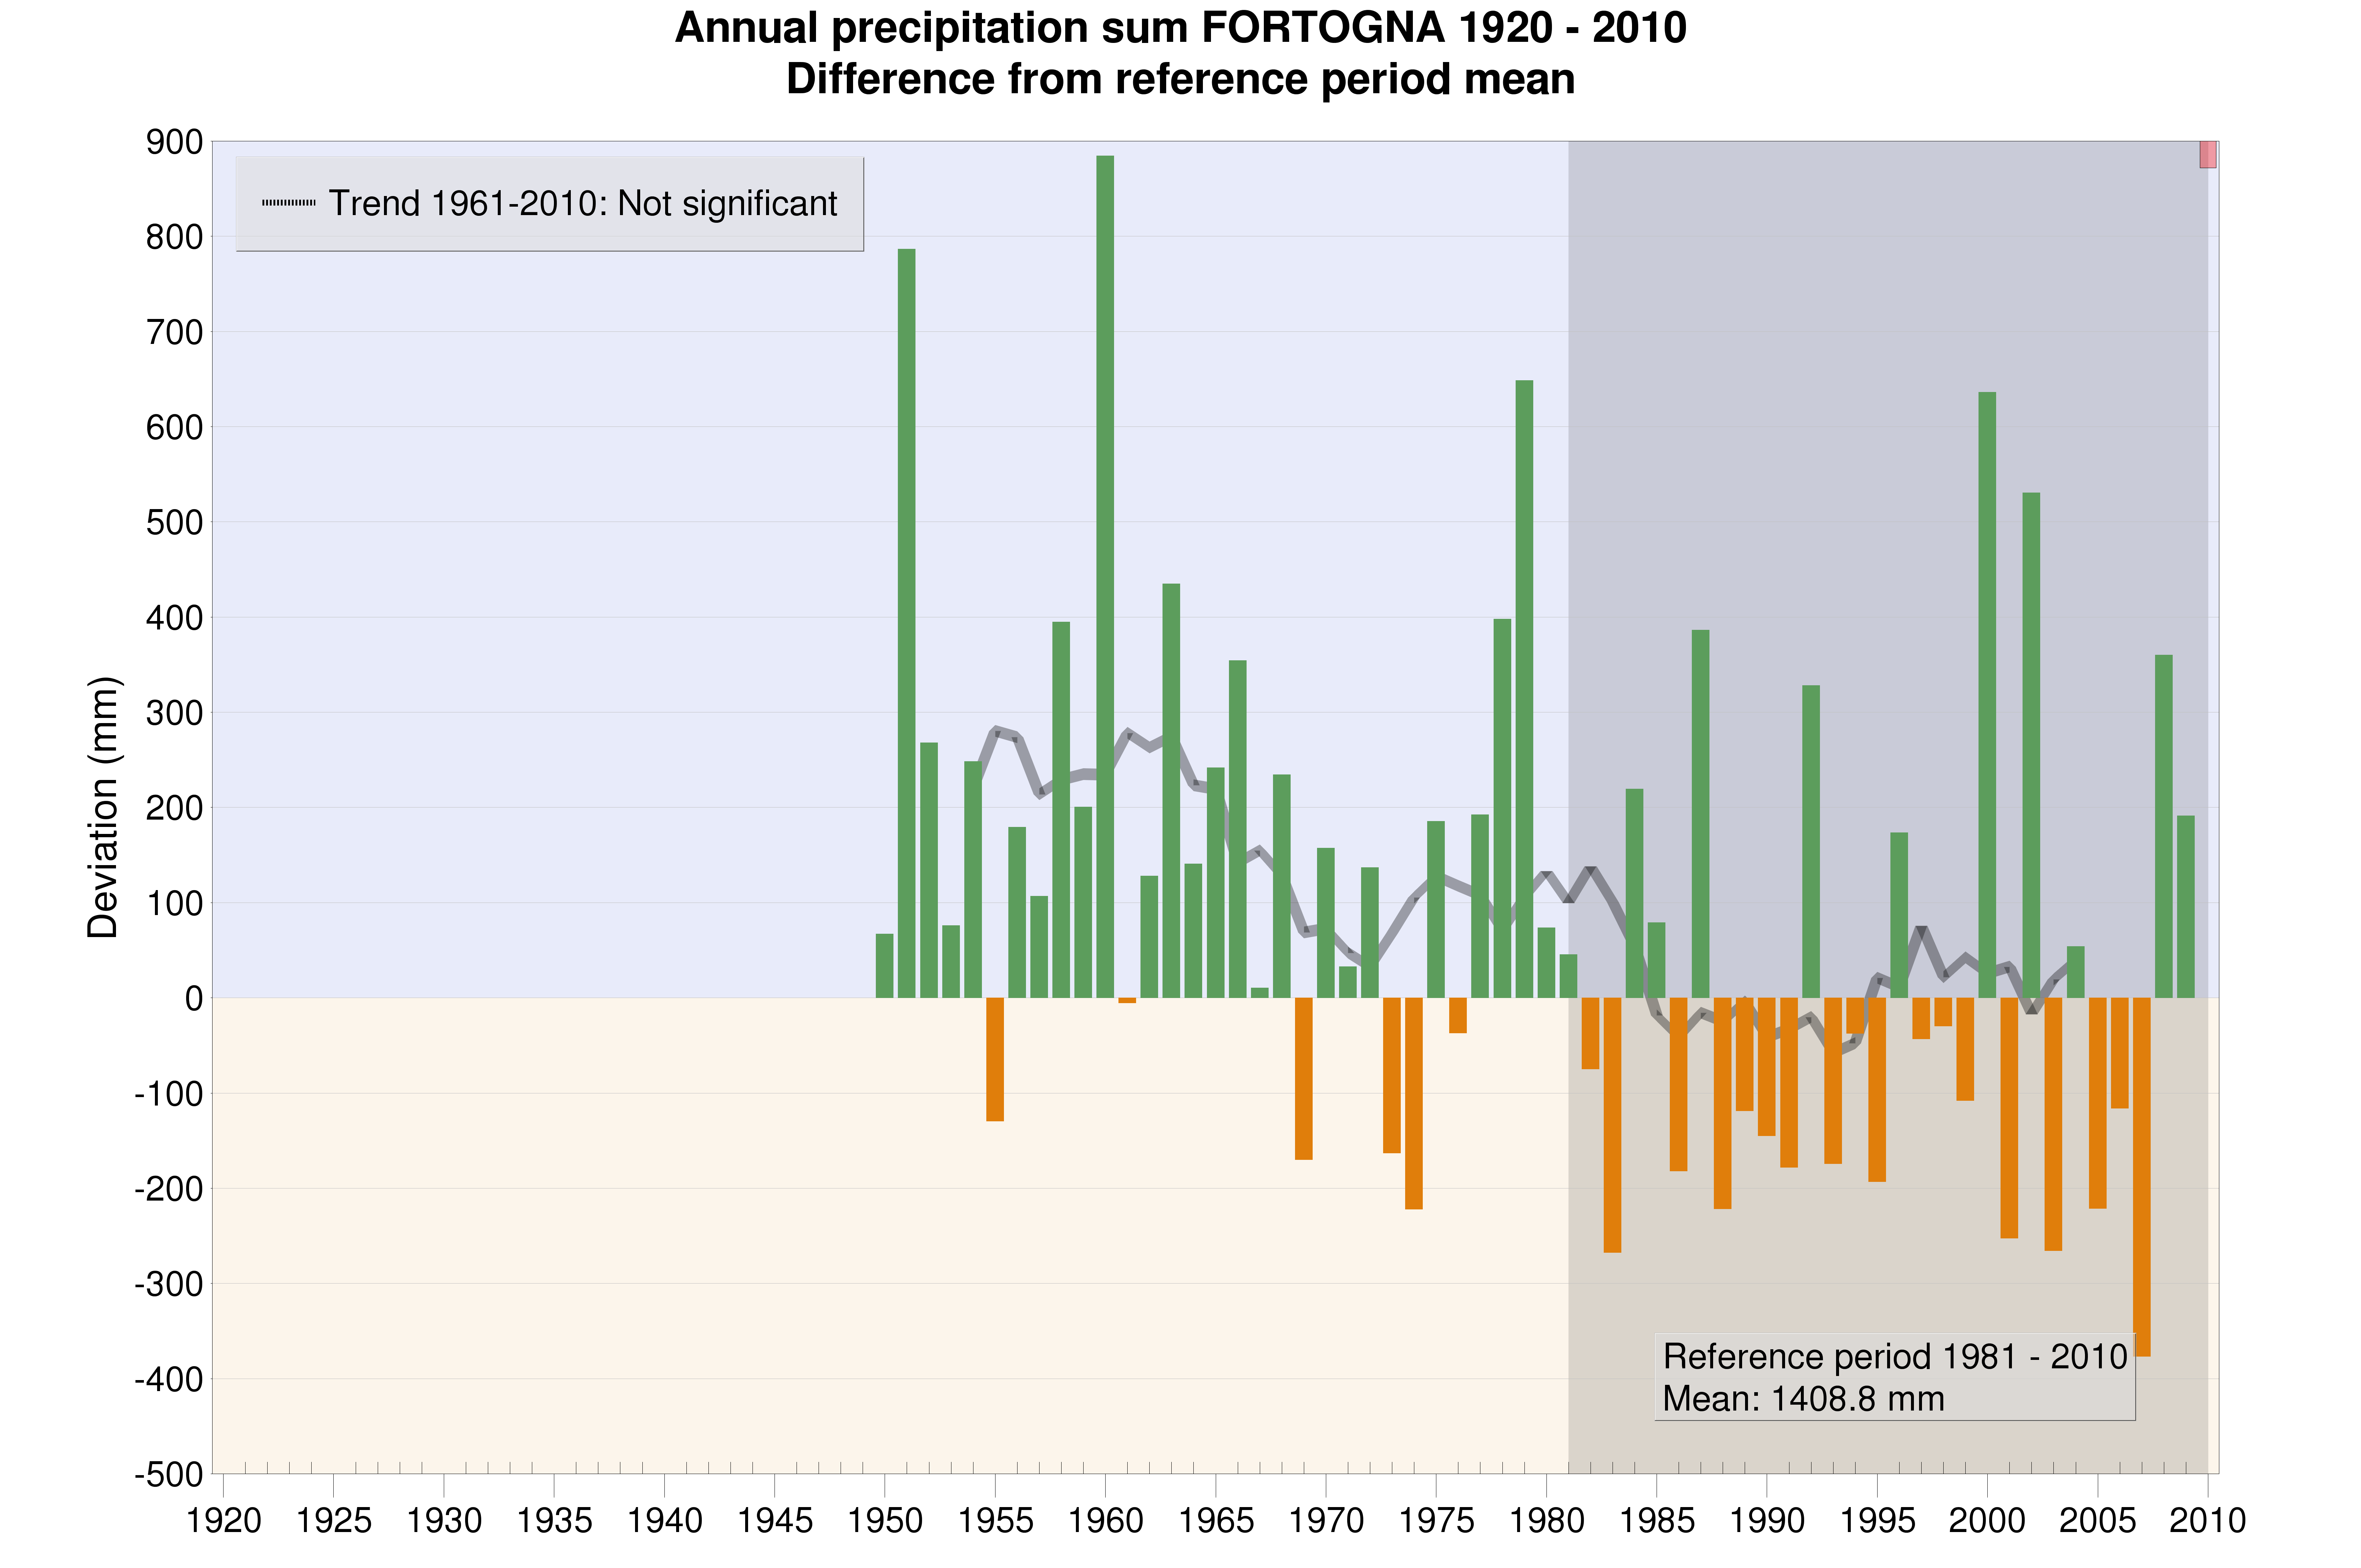
Fig. 12: Annual precipitation sum at Fortogna, shown as deviation from the climate mean 1981 to 2010.
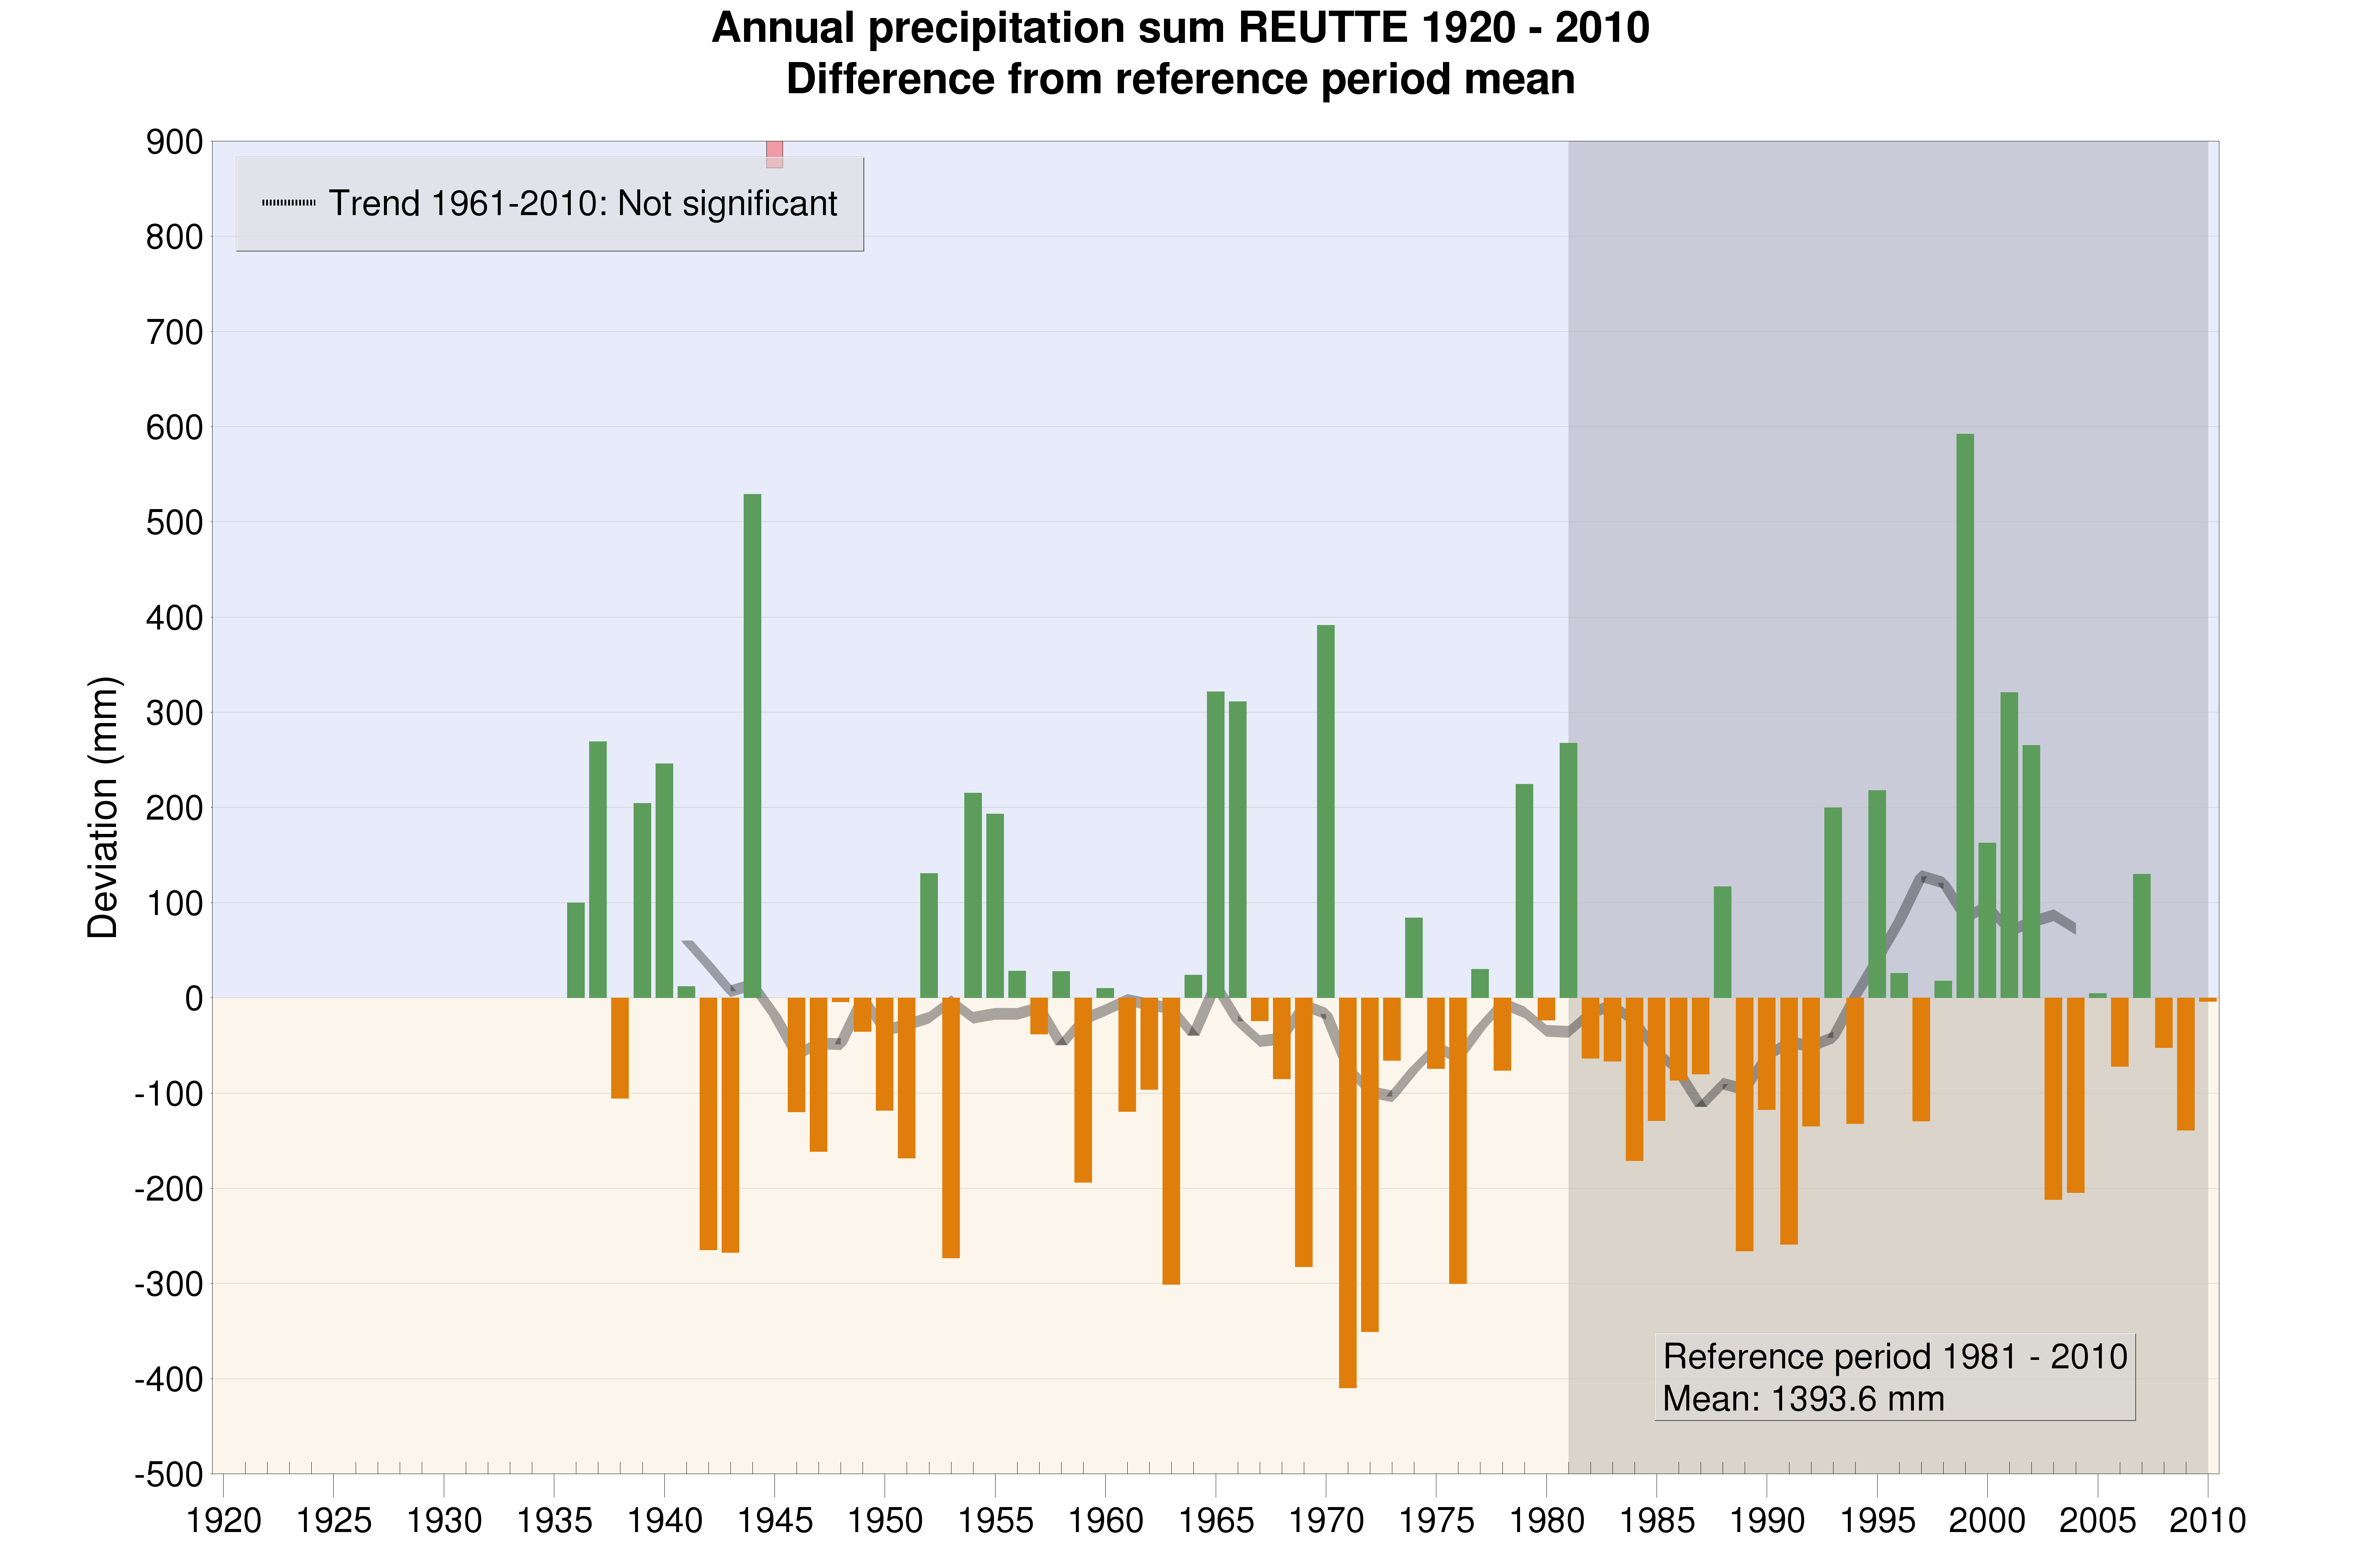
Fig. 13: Annual precipitation sum at Reutte, shown as deviation from the climate mean 1981 to 2010.
Evidence of increasing precipitation in the northwestern region of the Alps and an opposing decrease in the southeast are given in the investigations of the HISTALP dataset (Böhm 2008, S. 58), though these refer to the Greater Alpine Region.
When looking at changes in precipitation the question arises whether they are connected to an increase or decrease of the length of dry spells. In general the duration of periods without precipitation is mainly dependent on the position relative to the main Alpine crest. At stations north of the man crest the longest annual dry periods last about three weeks on average, south of it approximately four to six weeks. This can be seen from a comparison of Innsbruck and Sexten (Figures 14 and 15). While the annual precipitation sums at each location of about 860 mm are nearly identical, dry spells in Sexten average two weeks longer than in Innsbruck. As at all other stations no significant trend is recorded, though, so no change in the duration of dry spells has been observed.
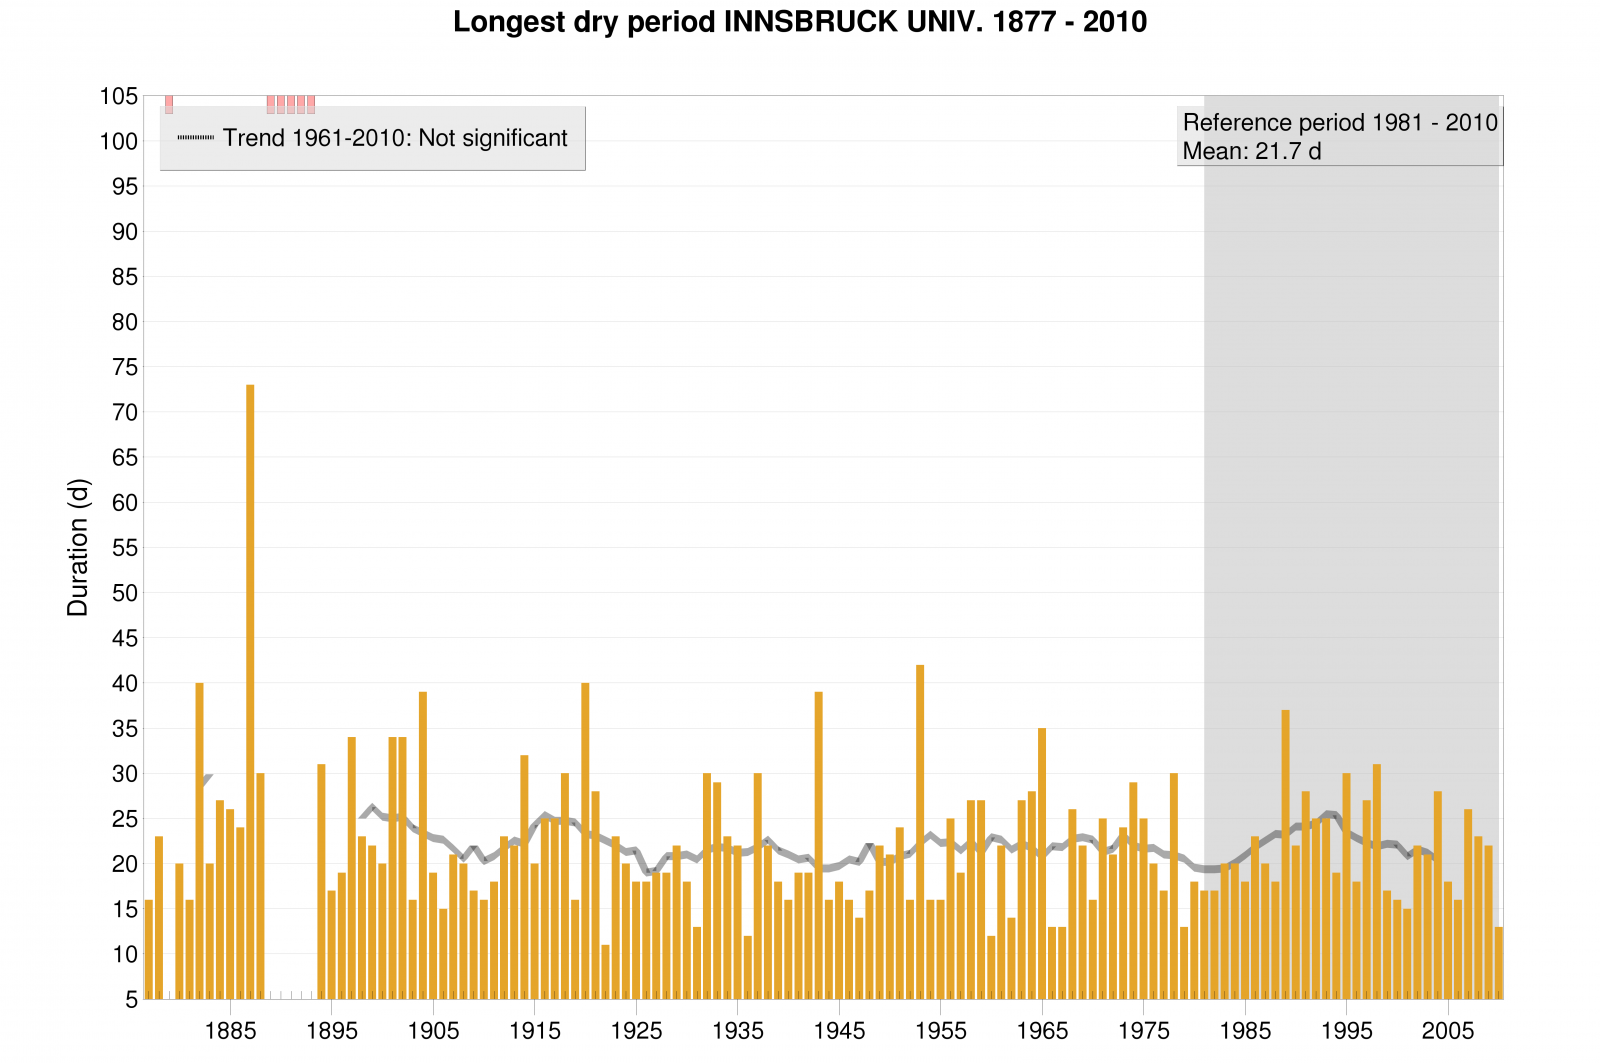
Fig. 14: Longest annual dry spell at Innsbruck.
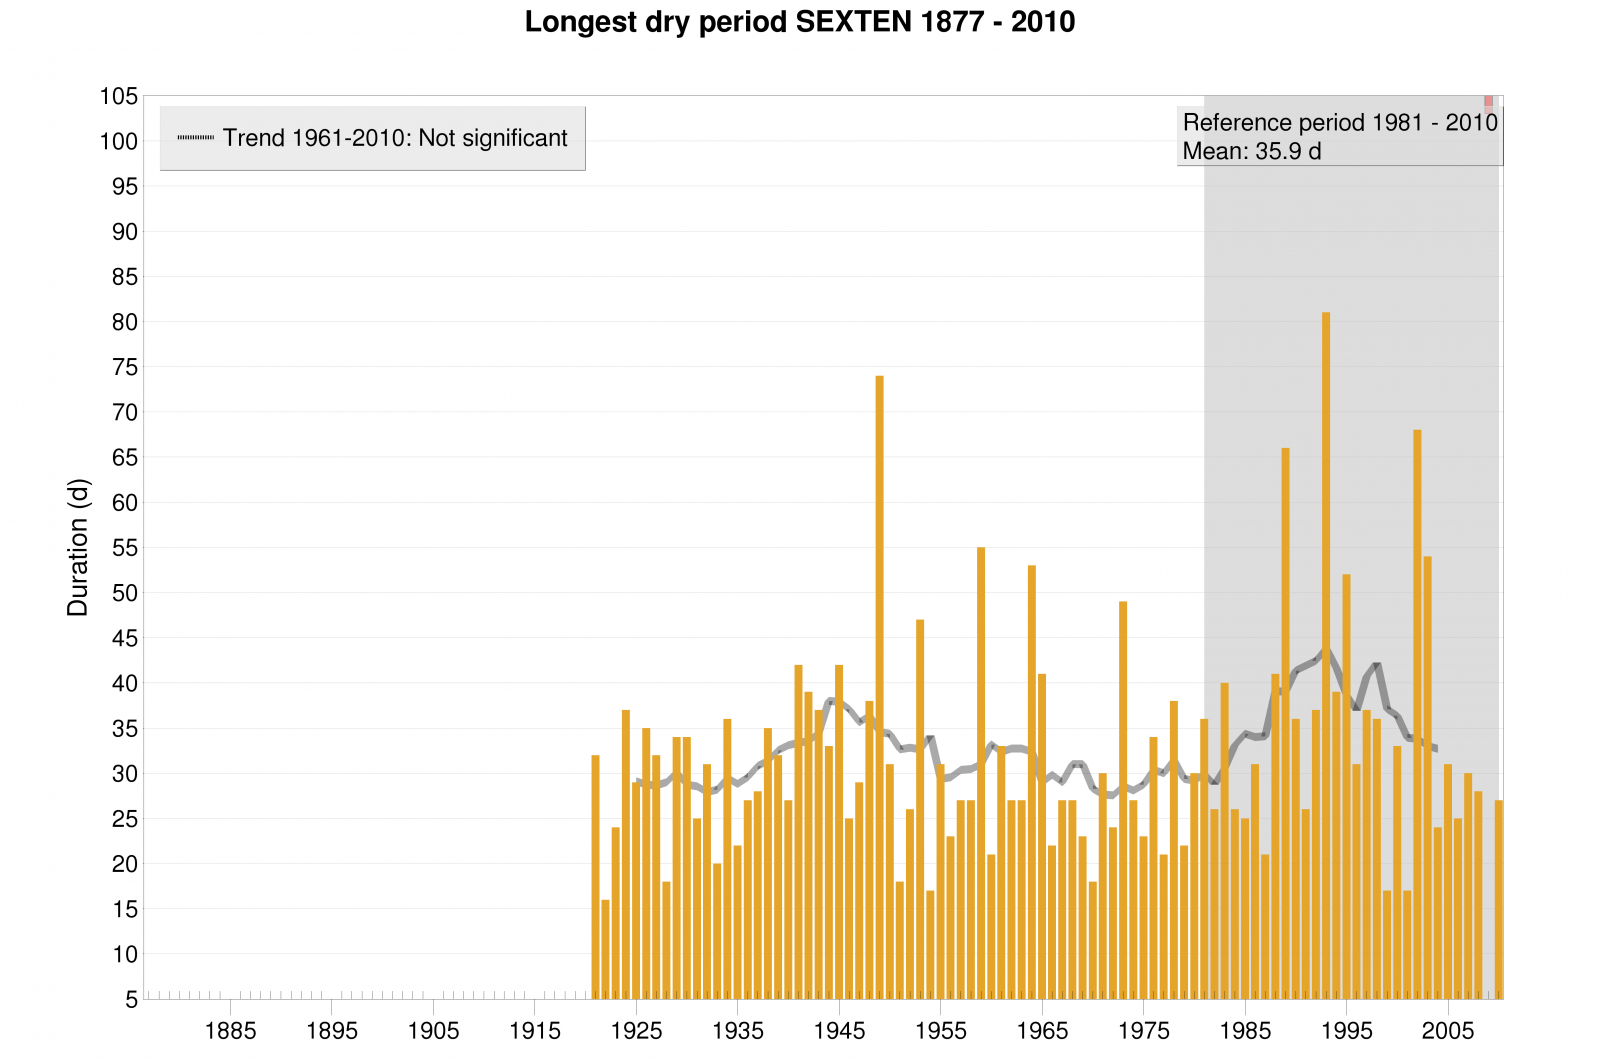
Fig. 15: Longest annual dry spell at Sexten.
References:
Auer I, Böhm R, Schöner W, 1999. ALOCLIM – Austrian-Central European long-term climate. Creation of a multiple homogenised long-term climate dataset. In: Proceedings of the 2nd seminar for homogenisation of surface climatological data. Budapest, Nov.1998. WCDMP 41, WMO-TD 962: 47-71
Böhm R, 2008: Harte und weiche Fakten zum Klimawandel – ein Überblick. In: Böhm R, Godina R, Nachtnebel HP, Pirker O, (Red.), Auswirkungen des Klimawandels auf die österreichische Wasserwirtschaft. Hrsg. vom BmLFUW und ÖWAV, Wien, 53-70
Böhm R., Auer I., Schöner W., Ganekind M., Gruber C., Jurkovic A., Orlik A., Ungersböck M., 2009b: Eine neue Webseite mit instrumentellen Qualitäts-Klimadaten für den Grossraum Alpen zurück bis 1760. Wiener Mitteilungen Band 216: Hochwässer: Bemessung, Risikoanalyse und Vorhersage
IPCC 2014, Climate Change 2014: Synthesis report, Intergovernmental Panel on Climate Change, 27th October – 1st November 2014, Kopenhagen.